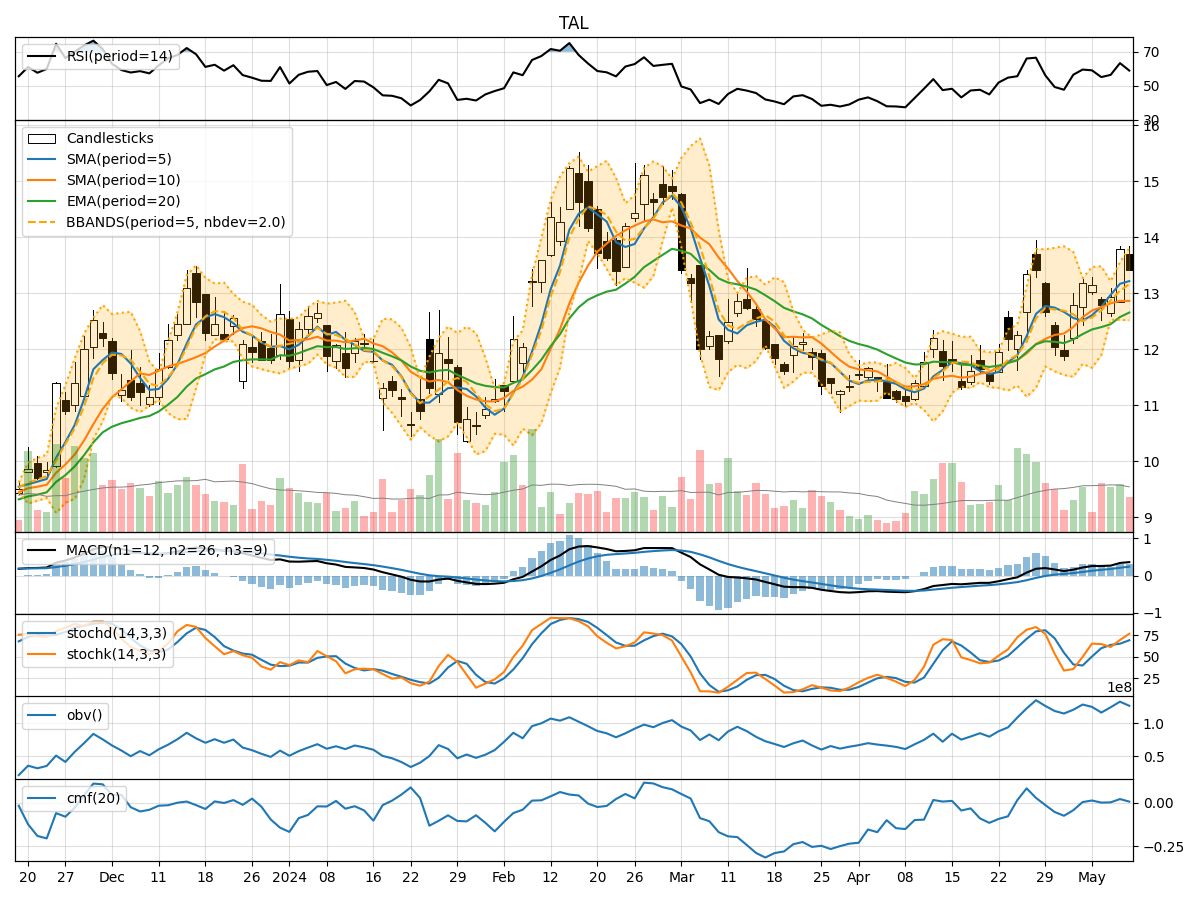
Technical Analysis of TAL 2024-05-10
Overview:
In analyzing the technical indicators for TAL over the last 5 days, we will delve into the trend, momentum, volatility, and volume indicators to provide a comprehensive outlook on the possible stock price movement. By examining these key aspects, we aim to offer valuable insights and predictions for the upcoming days.
Trend Indicators:
- Moving Averages (MA): The 5-day Moving Average (MA) has been consistently above the closing prices, indicating a bullish trend.
- MACD: The MACD line has been above the signal line for the past 5 days, suggesting a bullish momentum.
- EMA: The Exponential Moving Average (EMA) has been steadily increasing, supporting the bullish trend.
Momentum Indicators:
- RSI: The Relative Strength Index (RSI) has shown fluctuations but has generally been in the neutral zone, indicating a balanced momentum.
- Stochastic Oscillator: Both %K and %D have been fluctuating, showing mixed signals in momentum.
- Williams %R: The Williams %R has been oscillating, suggesting indecision in momentum direction.
Volatility Indicators:
- Bollinger Bands (BB): The Bollinger Bands have shown narrowing bands, indicating decreasing volatility.
- BB% (BB Percentage): The BB% has been fluctuating but has generally remained within a moderate range, signifying stable volatility.
Volume Indicators:
- On-Balance Volume (OBV): The OBV has shown mixed movements, indicating uncertainty in volume accumulation.
- Chaikin Money Flow (CMF): The CMF has been relatively stable, suggesting a neutral stance in volume flow.
Key Observations and Opinions:
- Trend: The trend indicators suggest a bullish sentiment with moving averages and MACD supporting upward momentum.
- Momentum: The momentum indicators show mixed signals with RSI in a neutral zone and stochastic oscillating, indicating indecision.
- Volatility: Volatility has been decreasing as per Bollinger Bands, signaling a potential consolidation phase.
- Volume: Volume indicators reflect uncertainty with OBV showing mixed movements and CMF indicating a neutral volume flow.
Conclusion:
Based on the analysis of the technical indicators, the next few days for TAL stock price movement could be sideways or consolidation. The bullish trend may face resistance due to mixed momentum signals and decreasing volatility. Investors should closely monitor key levels and wait for clearer signals before making significant trading decisions.