Technical Analysis of SUI 2024-05-31
Overview:
In analyzing the technical indicators for SUI over the last 5 days, we will delve into the trend, momentum, volatility, and volume indicators to provide a comprehensive outlook on the possible stock price movement in the coming days. By examining these key aspects, we aim to offer valuable insights and predictions for informed decision-making.
Trend Analysis:
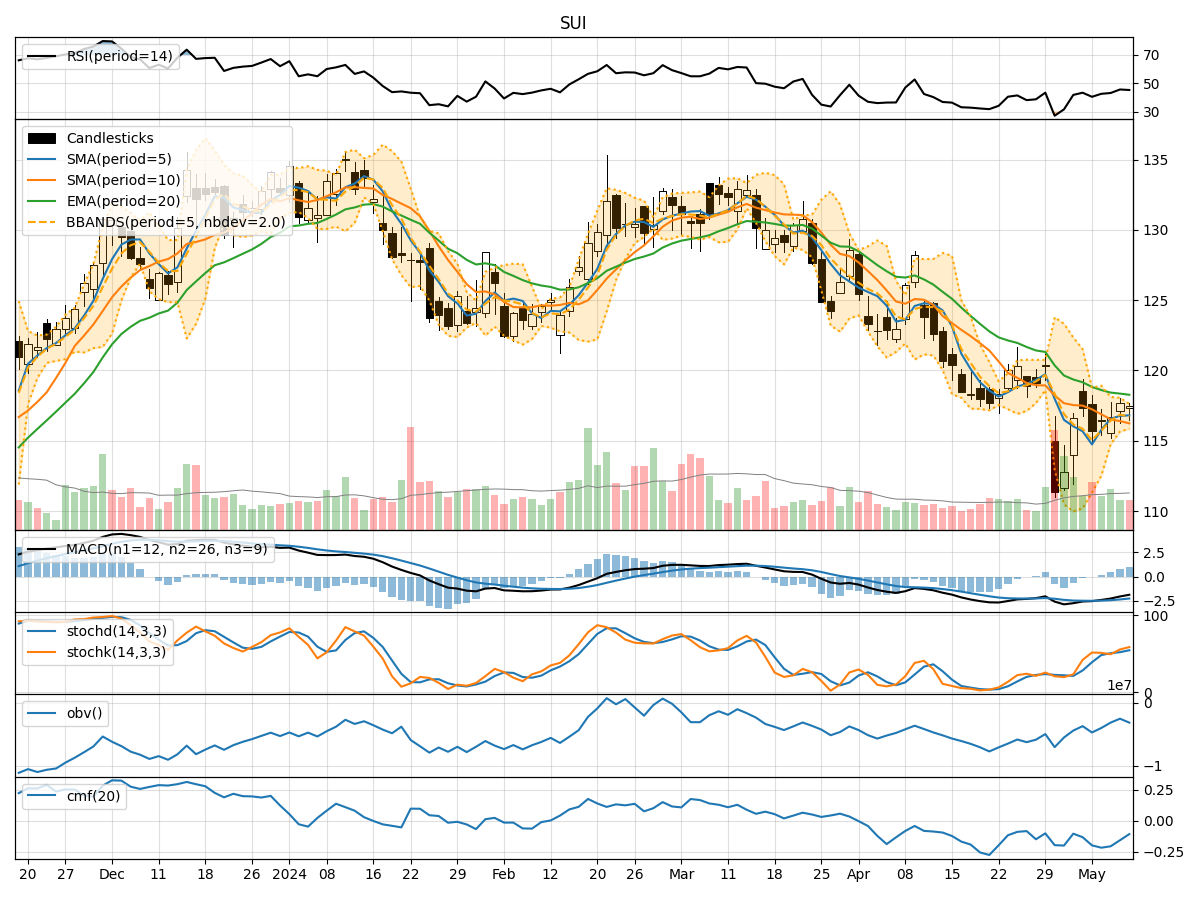
- Moving Averages (MA): The 5-day moving average has been consistently below the longer-term moving averages (SMA and EMA), indicating a downward trend.
- MACD: The MACD line has been below the signal line, with negative values, suggesting bearish momentum.
- RSI: The RSI values have been below 50, indicating a bearish sentiment in the market.
Momentum Analysis:
- Stochastic Oscillator: Both %K and %D values have been below 50, signaling a bearish momentum.
- Williams %R: The Williams %R values have been in the oversold territory, indicating a potential reversal or continuation of the downtrend.
Volatility Analysis:
- Bollinger Bands: The stock price has been trading below the middle Bollinger Band, suggesting a downward trend.
- Bollinger %B: The %B values have been below 0.5, indicating a bearish trend.
Volume Analysis:
- On-Balance Volume (OBV): The OBV values have been negative, reflecting selling pressure in the market.
- Chaikin Money Flow (CMF): The CMF values have been mostly negative, indicating a lack of buying interest.
Key Observations:
- The trend indicators, momentum oscillators, and volatility bands all point towards a bearish sentiment in the market.
- The volume indicators also support the bearish outlook, with negative OBV and CMF values.
- The stock is currently in a downtrend based on the moving averages and MACD analysis.
Conclusion:
Based on the analysis of the technical indicators, the next few days are likely to see a continuation of the bearish trend for SUI. Traders and investors should exercise caution and consider shorting or staying on the sidelines until a clear reversal pattern emerges. It is advisable to closely monitor key support levels and wait for bullish confirmation signals before considering long positions.