Technical Analysis of SU 2024-05-10
Overview:
In analyzing the technical indicators for SU stock over the last 5 days, we will delve into the trend, momentum, volatility, and volume indicators to provide a comprehensive outlook on the possible stock price movement in the coming days. By examining these key indicators, we aim to offer valuable insights and predictions for potential investors.
Trend Analysis:
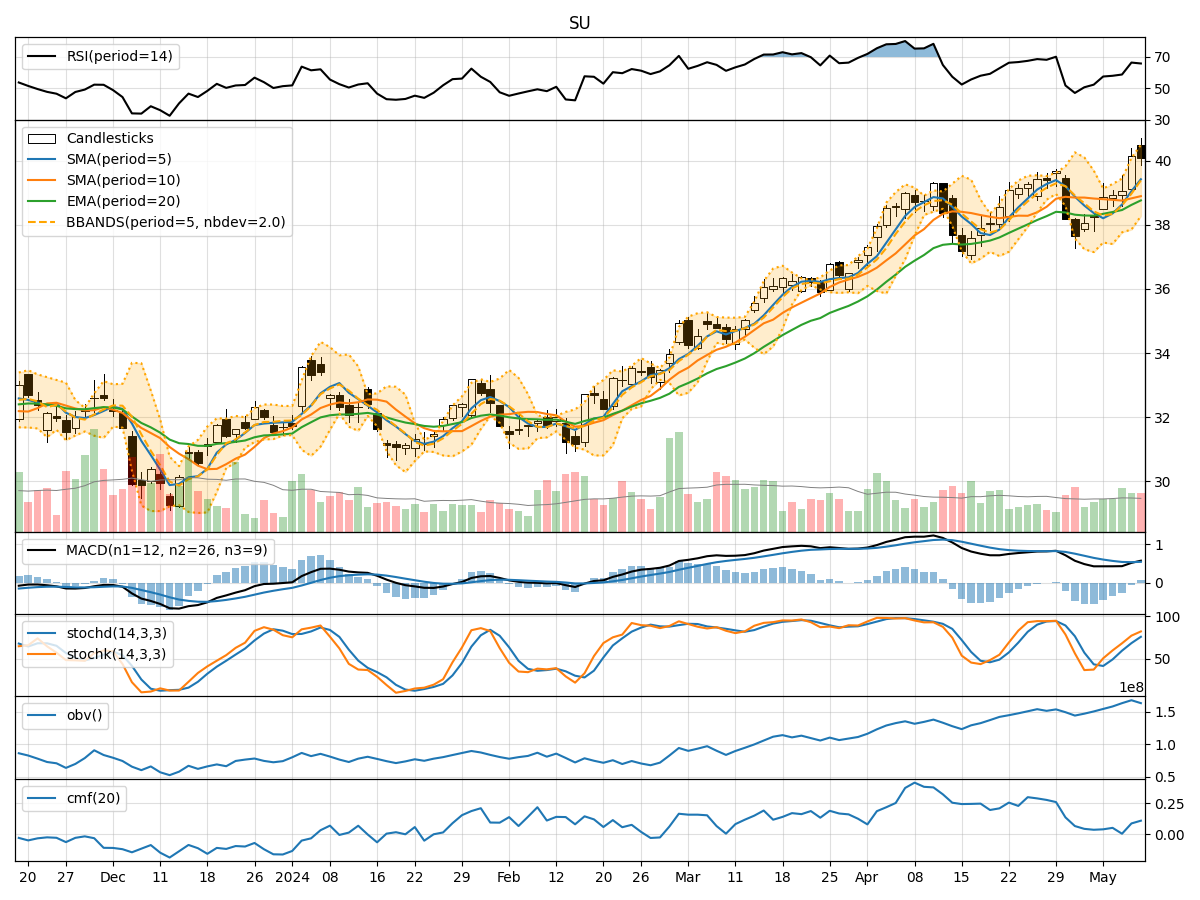
- Moving Averages (MA): The 5-day Moving Average (MA) has been consistently rising, indicating a bullish trend in the short term.
- MACD: The MACD line has been above the signal line for the past few days, suggesting positive momentum in the stock price.
- EMA: The Exponential Moving Average (EMA) has also been trending upwards, supporting the bullish sentiment in the market.
Momentum Analysis:
- RSI: The Relative Strength Index (RSI) has been increasing, reaching overbought levels, indicating a strong bullish momentum.
- Stochastic Oscillator: Both %K and %D lines of the Stochastic Oscillator are in the overbought zone, signaling a potential reversal or consolidation.
- Williams %R: The Williams %R is in the oversold territory, suggesting a possible pullback in the stock price.
Volatility Analysis:
- Bollinger Bands: The Bollinger Bands are widening, indicating increased volatility in the stock price.
- Bollinger %B: The %B indicator is below 1, suggesting that the stock price is trading below the upper Bollinger Band, potentially signaling a buying opportunity.
- Average True Range (ATR): The ATR can provide insights into the volatility of the stock, helping traders set appropriate stop-loss levels.
Volume Analysis:
- On-Balance Volume (OBV): The OBV has been increasing, indicating that volume has been higher on days with upward price movement.
- Chaikin Money Flow (CMF): The CMF is positive, suggesting that money is flowing into the stock, supporting the bullish outlook.
Conclusion:
Based on the analysis of the technical indicators, the stock of SU is currently in a strong bullish trend with positive momentum and increasing volume. However, the overbought conditions in the RSI and Stochastic Oscillator indicate a potential for a short-term pullback or consolidation. Traders should closely monitor the price action and key support levels to assess the sustainability of the uptrend.
In the next few days, we can expect the stock price of SU to consolidate or experience a minor pullback before potentially resuming its upward trajectory. Investors should consider waiting for a better entry point during any pullback to capitalize on the overall bullish trend in the stock.