Technical Analysis of STT 2024-05-10
Overview:
In analyzing the technical indicators for STT over the last 5 days, we will delve into the trend, momentum, volatility, and volume indicators to provide a comprehensive outlook on the possible stock price movement in the coming days. By examining these key aspects, we aim to offer valuable insights and predictions for informed decision-making.
Trend Indicators:
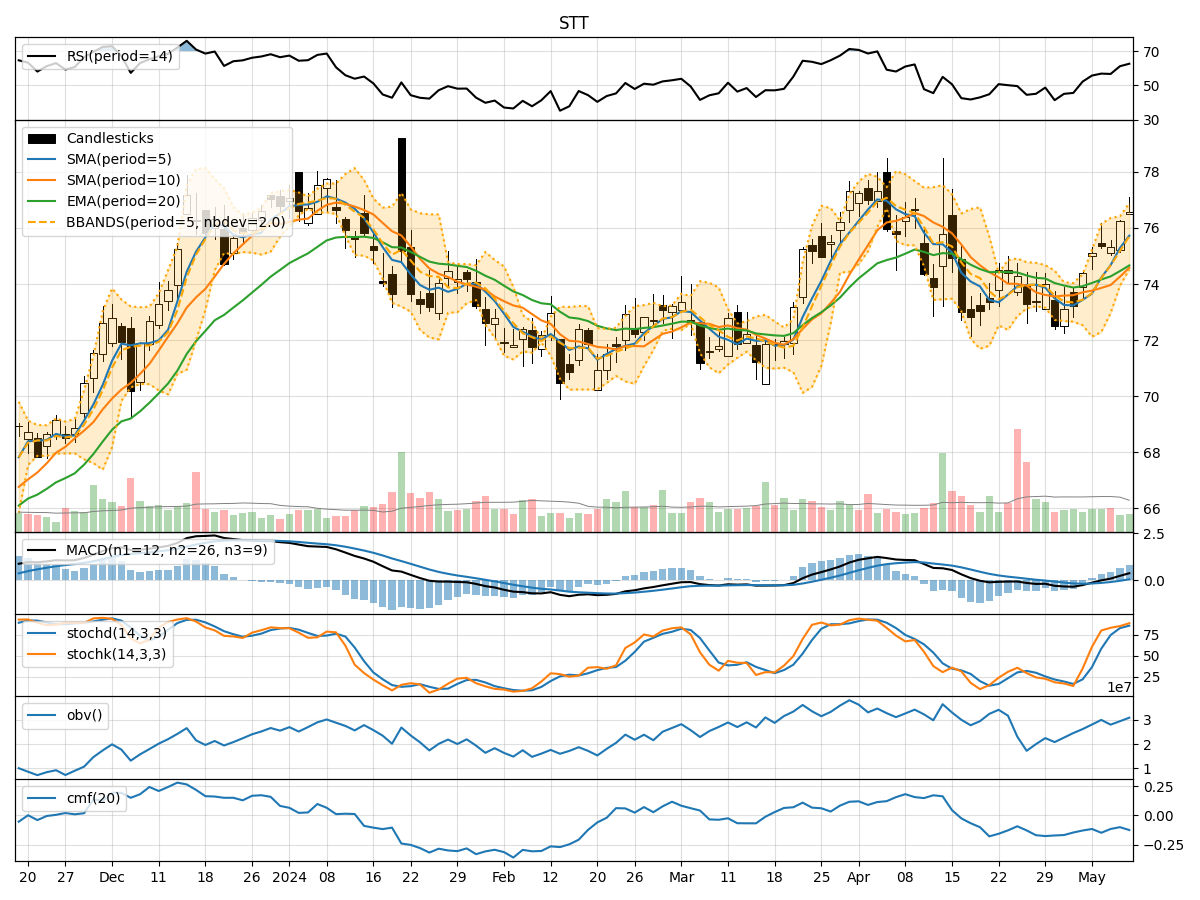
- Moving Averages (MA): The 5-day moving average has been consistently above the simple moving average (SMA) and exponential moving average (EMA), indicating a bullish trend.
- MACD: The MACD line has been consistently above the signal line, with both lines showing an upward trend, suggesting bullish momentum.
- Conclusion: The trend indicators point towards an upward movement in the stock price.
Momentum Indicators:
- RSI: The Relative Strength Index has been trending upwards, indicating increasing buying pressure.
- Stochastic Oscillator: Both %K and %D have been in the overbought zone, suggesting a strong bullish momentum.
- Conclusion: Momentum indicators signal a bullish sentiment in the market.
Volatility Indicators:
- Bollinger Bands: The stock price has been trading within the upper Bollinger Band, indicating high volatility.
- Conclusion: Volatility indicators suggest a volatile price movement in the near future.
Volume Indicators:
- On-Balance Volume (OBV): The OBV has been fluctuating but generally showing a slight increase, indicating accumulation.
- Chaikin Money Flow (CMF): The CMF has been negative, suggesting some selling pressure.
- Conclusion: Volume indicators imply a mixed sentiment with a slight bias towards accumulation.
Overall Conclusion:
Based on the analysis of trend, momentum, volatility, and volume indicators, the overall outlook for STT is bullish with a potential for upward price movement in the coming days. The strong bullish trend, positive momentum, and relatively high volatility indicate a favorable environment for price appreciation. However, it is essential to monitor the volume closely as it suggests a mixed sentiment. Traders and investors should consider entering long positions with appropriate risk management strategies to capitalize on the expected upward movement in the stock price.
Key Takeaways:
- Trend: Upward
- Momentum: Bullish
- Volatility: High
- Volume: Mixed, slight accumulation
In conclusion, the technical analysis of STT indicates a positive outlook, with the potential for the stock price to continue its upward trajectory. Traders should closely monitor the trend and momentum indicators for confirmation of the bullish sentiment. It is advisable to conduct further analysis and stay updated on market developments to make well-informed trading decisions.