Technical Analysis of STN 2024-05-10
Overview:
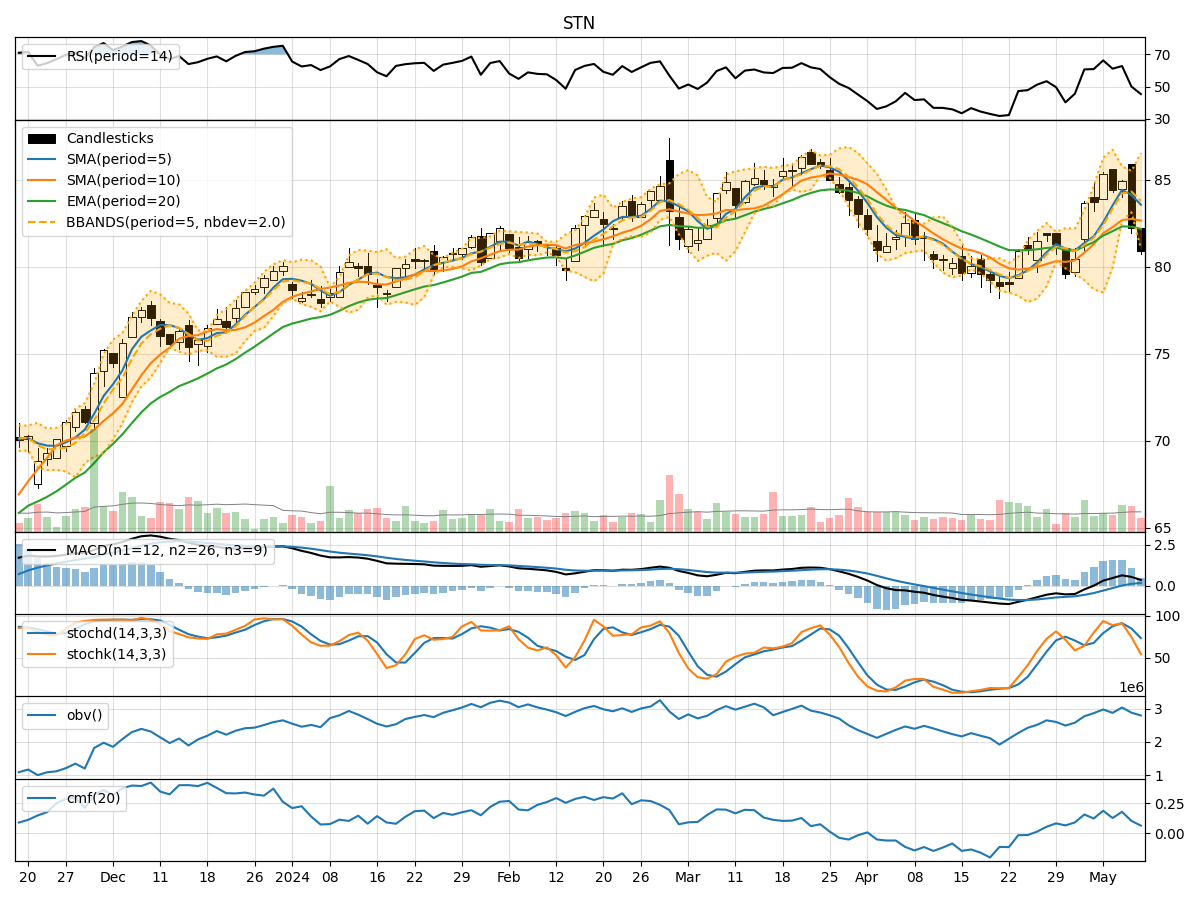
In analyzing the technical indicators for STN over the last 5 days, we will delve into the trend, momentum, volatility, and volume indicators to provide a comprehensive outlook on the possible stock price movement. By examining these key aspects, we aim to offer valuable insights and predictions for the upcoming days.
Trend Indicators:
- Moving Averages (MA): The 5-day Moving Average (MA) has been trending above the Simple Moving Average (SMA) and Exponential Moving Average (EMA), indicating a bullish trend.
- MACD: The Moving Average Convergence Divergence (MACD) has shown positive values, with the MACD line consistently above the signal line, suggesting bullish momentum.
- Conclusion: The trend indicators point towards an upward trend in the stock price.
Momentum Indicators:
- RSI: The Relative Strength Index (RSI) has been fluctuating but generally staying within the neutral range, indicating a balanced momentum.
- Stochastic Oscillator: The Stochastic Oscillator has shown mixed signals, with some divergence between %K and %D, suggesting potential indecision in momentum.
- Conclusion: The momentum indicators suggest a sideways movement or a potential consolidation phase.
Volatility Indicators:
- Bollinger Bands: The Bollinger Bands have shown narrowing bands, indicating decreasing volatility and a possible period of consolidation.
- Conclusion: Volatility indicators suggest a sideways movement or a consolidation phase in the stock price.
Volume Indicators:
- On-Balance Volume (OBV): The OBV has shown mixed signals, with alternating positive and negative values, indicating indecision in volume accumulation.
- Chaikin Money Flow (CMF): The CMF has been relatively low, suggesting a lack of strong buying or selling pressure.
- Conclusion: Volume indicators reflect a neutral stance with no clear direction in volume accumulation.
Overall Conclusion:
Based on the analysis of trend, momentum, volatility, and volume indicators, the next few days for STN stock price could see a sideways movement or a consolidation phase. The trend indicators point towards an upward bias, while momentum and volume indicators suggest a lack of clear direction or significant buying/selling pressure. Volatility indicators indicate a potential period of consolidation with reduced price fluctuations.
Recommendation:
Given the mixed signals from the technical indicators, it is advisable for investors to exercise caution and closely monitor the stock price movement in the coming days. Consider setting tight stop-loss orders to manage risk effectively in case of unexpected price swings. Additionally, staying informed about any market developments or news that could impact the stock's performance is crucial for making well-informed investment decisions.
Disclaimer:
Remember that technical analysis is not a guaranteed predictor of future price movements, and other fundamental factors and market dynamics can influence stock prices. It is essential to conduct thorough research and consider multiple indicators before making any investment decisions. Consulting with a financial advisor can provide personalized insights tailored to your specific investment goals and risk tolerance level.