Technical Analysis of SSL 2024-05-10
Overview:
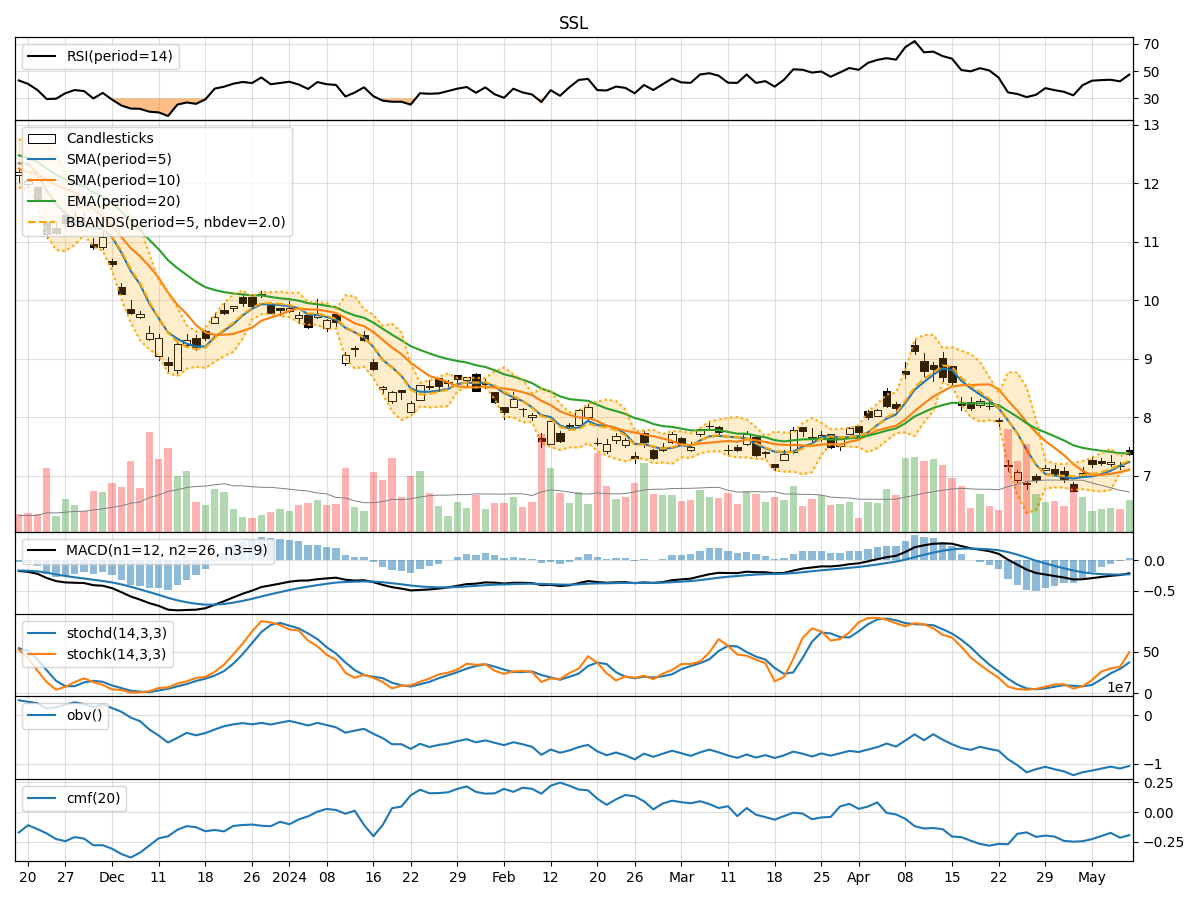
In analyzing the technical indicators for SSL stock over the last 5 days, we will delve into the trend, momentum, volatility, and volume indicators to provide a comprehensive outlook on the possible stock price movement in the coming days. By examining these key indicators, we aim to offer valuable insights and predictions for potential investors.
Trend Analysis:
- Moving Averages (MA): The 5-day MA has been consistently above the closing prices, indicating a short-term uptrend.
- MACD: The MACD line has been below the signal line, suggesting a bearish momentum in the short term.
- EMA: The exponential moving average has been declining, reflecting a weakening trend.
Key Observation: The trend indicators show mixed signals with a slight bearish bias due to the MACD and EMA trends.
Momentum Analysis:
- RSI: The RSI has been fluctuating around the neutral zone, indicating indecision in the market.
- Stochastic Oscillator: Both %K and %D have been rising, suggesting increasing buying pressure.
- Williams %R: The indicator has moved from oversold to neutral territory, signaling a potential reversal.
Key Observation: Momentum indicators point towards a potential shift from bearish to neutral sentiment.
Volatility Analysis:
- Bollinger Bands: The stock price has been trading within the bands, indicating normal volatility.
- Bollinger %B: The %B has fluctuated within the range, reflecting price consolidation.
Key Observation: Volatility indicators suggest a period of consolidation and range-bound trading.
Volume Analysis:
- On-Balance Volume (OBV): The OBV has been declining, indicating selling pressure.
- Chaikin Money Flow (CMF): The CMF has been negative, signaling outflows from the stock.
Key Observation: Volume indicators point towards a bearish sentiment with more selling pressure.
Conclusion:
Based on the analysis of the technical indicators, the stock price of SSL is likely to experience further downside movement in the coming days. The trend indicators show a weakening trend, while momentum indicators suggest a potential shift from bearish to neutral sentiment. Volatility indicators indicate a period of consolidation, and volume indicators highlight selling pressure.
Overall Assessment: The combination of bearish trend, neutral to slightly positive momentum, consolidation in volatility, and bearish volume signals leads to a bearish outlook for SSL stock in the near term. Investors should exercise caution and consider waiting for more definitive signals before making any trading decisions.