Technical Analysis of SQ 2024-05-10
Overview:
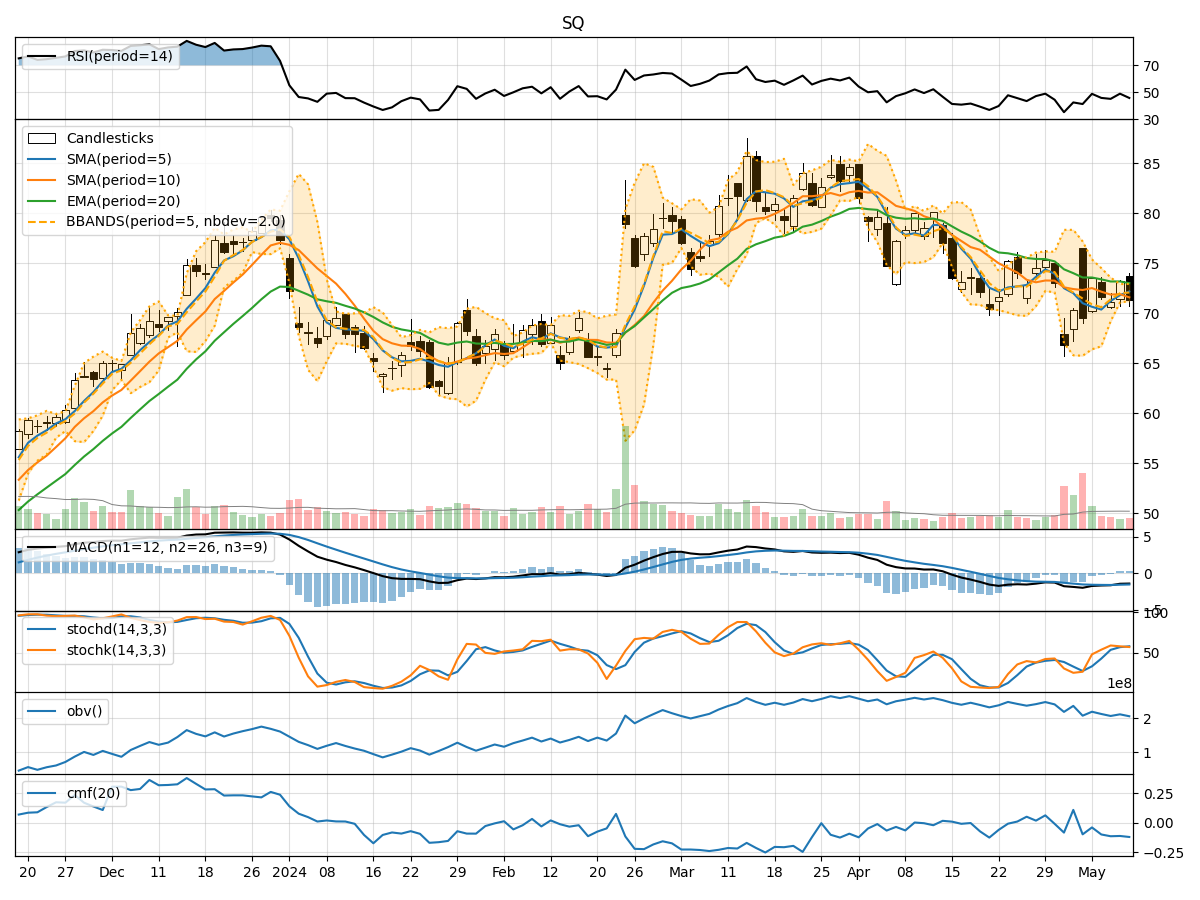
In analyzing the technical indicators for SQ over the last 5 days, we will delve into the trend, momentum, volatility, and volume indicators to provide a comprehensive outlook on the possible stock price movement. By examining these key factors, we aim to offer valuable insights and predictions for the upcoming days.
Trend Analysis:
- Moving Averages (MA): The 5-day Moving Average (MA) has been fluctuating around the closing prices, indicating short-term price trends. The Simple Moving Average (SMA) and Exponential Moving Average (EMA) show a downward trend, with the EMA slightly below the SMA.
- MACD: The Moving Average Convergence Divergence (MACD) is negative, suggesting a bearish momentum in the stock price.
- Conclusion: The trend indicators point towards a downward trend in the stock price.
Momentum Analysis:
- RSI: The Relative Strength Index (RSI) has been hovering around the mid-range, indicating a lack of strong momentum in either direction.
- Stochastic Oscillator: Both %K and %D values are not in extreme territories, suggesting a neutral momentum.
- Conclusion: The momentum indicators reflect a sideways movement in the stock price.
Volatility Analysis:
- Bollinger Bands (BB): The Bollinger Bands are narrowing, indicating decreasing volatility in the stock price.
- Conclusion: The volatility indicators suggest a consolidation phase in the stock price.
Volume Analysis:
- On-Balance Volume (OBV): The OBV has been fluctuating, indicating mixed buying and selling pressure.
- Chaikin Money Flow (CMF): The CMF is negative, signaling a bearish money flow.
- Conclusion: The volume indicators imply a bearish sentiment in the stock.
Overall Conclusion:
Based on the analysis of trend, momentum, volatility, and volume indicators, the overall outlook for SQ in the next few days is bearish. The trend indicators show a downward trajectory, while momentum suggests a lack of strong direction. Volatility is decreasing, indicating a consolidation phase, and volume indicators point towards a bearish sentiment.
Recommendation:
Considering the bearish outlook, investors may consider adopting a cautious approach or potentially look for short-selling opportunities. It is essential to closely monitor the price action and key support levels to validate the bearish thesis. Additionally, keeping an eye on any significant news or market developments that could impact SQ's price movement is crucial for making informed trading decisions.
Disclaimer:
This analysis is based solely on technical indicators and does not take into account fundamental factors or external market influences. It is essential to conduct thorough research and consider multiple sources of information before making any investment decisions. Consulting with a financial advisor is recommended to align investment strategies with individual risk tolerance and financial goals.