Technical Analysis of SPOT 2024-05-10
Overview:
In analyzing the technical indicators for SPOT over the last 5 days, we will delve into the trend, momentum, volatility, and volume indicators to provide a comprehensive outlook on the possible stock price movement in the coming days.
Trend Analysis:
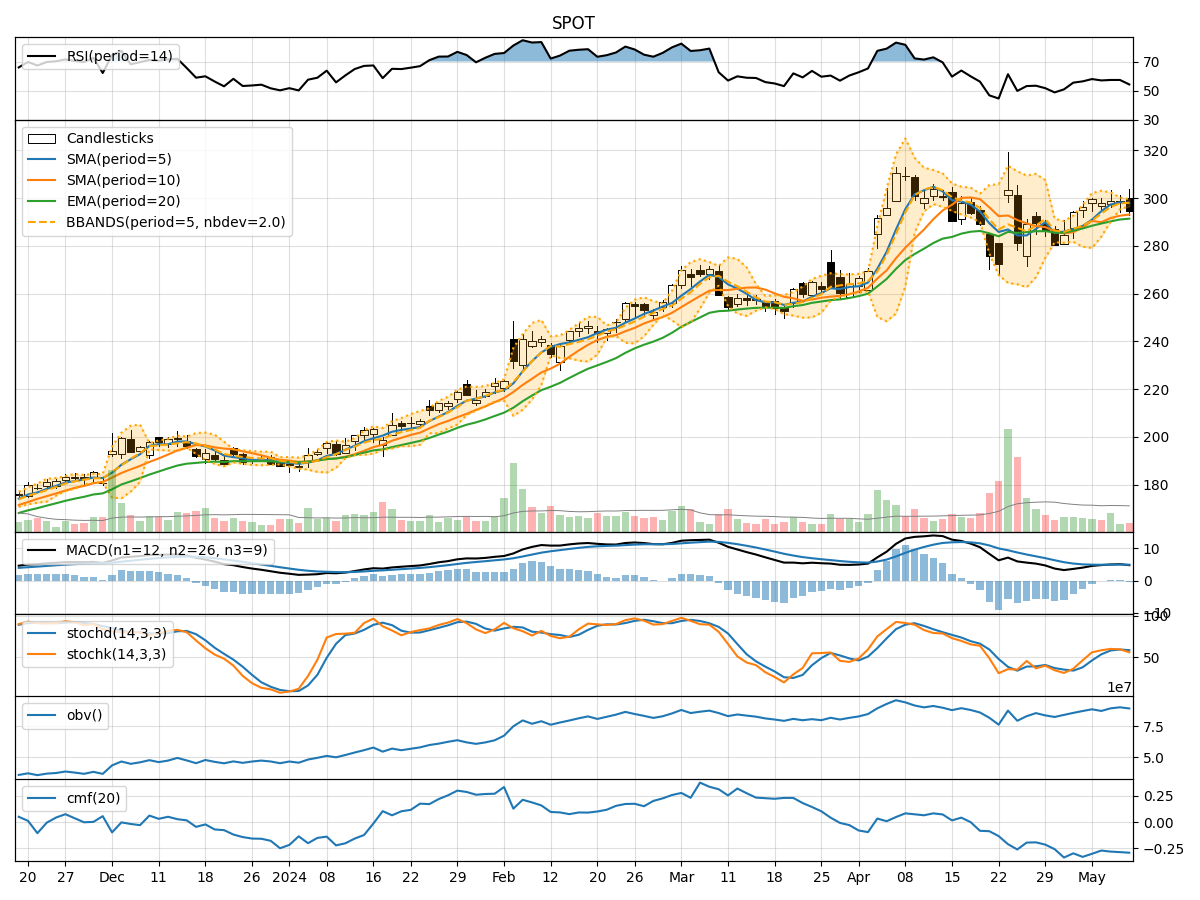
- Moving Averages (MA): The 5-day Moving Average (MA) has been consistently above the Simple Moving Average (SMA) and Exponential Moving Average (EMA), indicating a bullish trend.
- MACD: The MACD line has been mostly positive, with the MACD Histogram fluctuating around the zero line, suggesting potential shifts in momentum.
Momentum Analysis:
- RSI: The Relative Strength Index (RSI) has been fluctuating around the mid-level, indicating a balanced momentum.
- Stochastic Oscillator: Both %K and %D have been in the neutral zone, suggesting a lack of strong directional momentum.
Volatility Analysis:
- Bollinger Bands (BB): The Bollinger Bands have shown narrowing volatility, with the price mostly trading within the bands, indicating a period of consolidation.
Volume Analysis:
- On-Balance Volume (OBV): The OBV has been relatively stable, indicating a balance between buying and selling pressure.
- Chaikin Money Flow (CMF): The CMF has been negative, suggesting a slight distribution phase.
Key Observations:
- The trend indicators point towards a bullish sentiment, supported by the moving averages and MACD.
- Momentum indicators show a lack of strong momentum in either direction, indicating a potential period of consolidation.
- Volatility has been decreasing, suggesting a possible tightening range in the stock price.
- Volume indicators reflect a balanced market sentiment with no clear dominance of buying or selling pressure.
Conclusion:
Based on the analysis of the technical indicators, the stock price of SPOT is likely to consolidate in the coming days. The bullish trend indicated by moving averages and MACD may lead to sideways movement as momentum remains neutral. The decreasing volatility and balanced volume further support the view of a sideways trend with no significant directional bias. Traders may consider range-bound strategies until a clear breakout or breakdown signal is observed in the technical indicators.