Technical Analysis of SPNT 2024-05-10
Overview:
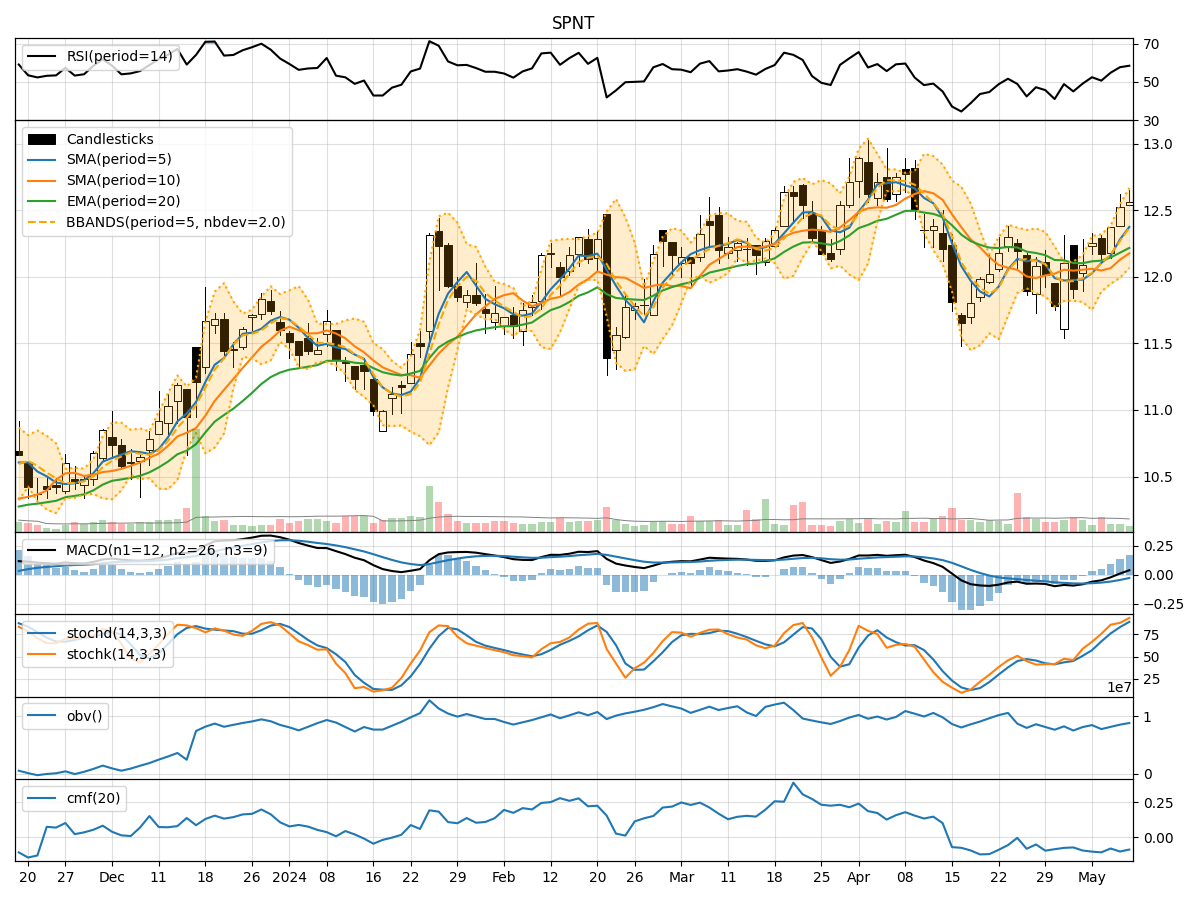
In analyzing the technical indicators for SPNT over the last 5 days, we will delve into the trend, momentum, volatility, and volume indicators to provide a comprehensive outlook on the possible stock price movement in the coming days. By examining these key indicators, we aim to offer valuable insights and predictions for informed decision-making.
Trend Analysis:
- Moving Averages (MA): The 5-day MA has been consistently above the closing prices, indicating a short-term uptrend.
- MACD: The MACD line has been trending upwards, with the MACD histogram showing positive values, suggesting bullish momentum.
- RSI: The RSI has been fluctuating around the 50 level, indicating a neutral stance in terms of momentum.
Momentum Analysis:
- Stochastic Oscillator: Both %K and %D have been in overbought territory, signaling a potential reversal or consolidation.
- Williams %R: The indicator has been hovering around oversold levels, suggesting a possible buying opportunity.
Volatility Analysis:
- Bollinger Bands (BB): The stock price has been trading within the bands, indicating a period of consolidation.
- BB %B: The %B indicator has been fluctuating within a narrow range, reflecting low volatility.
Volume Analysis:
- On-Balance Volume (OBV): The OBV has been declining, indicating selling pressure in the stock.
- Chaikin Money Flow (CMF): The CMF has been negative, suggesting a lack of buying interest.
Conclusion:
Based on the analysis of the technical indicators, the stock is currently in a consolidation phase with neutral to slightly bullish bias. The trend indicators show a short-term uptrend, supported by the MACD, while momentum indicators suggest a potential reversal or consolidation in the near term. Volatility remains low, as indicated by the Bollinger Bands, and volume indicators point towards selling pressure.
Recommendation:
- Short-Term: Expect the stock to trade within a narrow range with a slight upward bias.
- Long-Term: Monitor the trend closely for a potential breakout above resistance levels.
- Risk Management: Consider setting stop-loss orders to protect gains in case of a sudden downturn.
Key Takeaways:
- Upward Bias: Short-term trend is bullish.
- Consolidation: Stock price likely to consolidate in the near term.
- Caution: Watch for potential reversal signals in momentum indicators.
By considering these insights and monitoring the key indicators closely, investors can make well-informed decisions regarding their positions in SPNT.