Technical Analysis of SNAP 2024-05-10
Overview:
In analyzing the technical indicators for SNAP over the last 5 days, we will delve into the trend, momentum, volatility, and volume indicators to provide a comprehensive outlook on the possible stock price movement in the coming days. By examining these key aspects, we aim to offer valuable insights and predictions for potential investors and traders.
Trend Indicators:
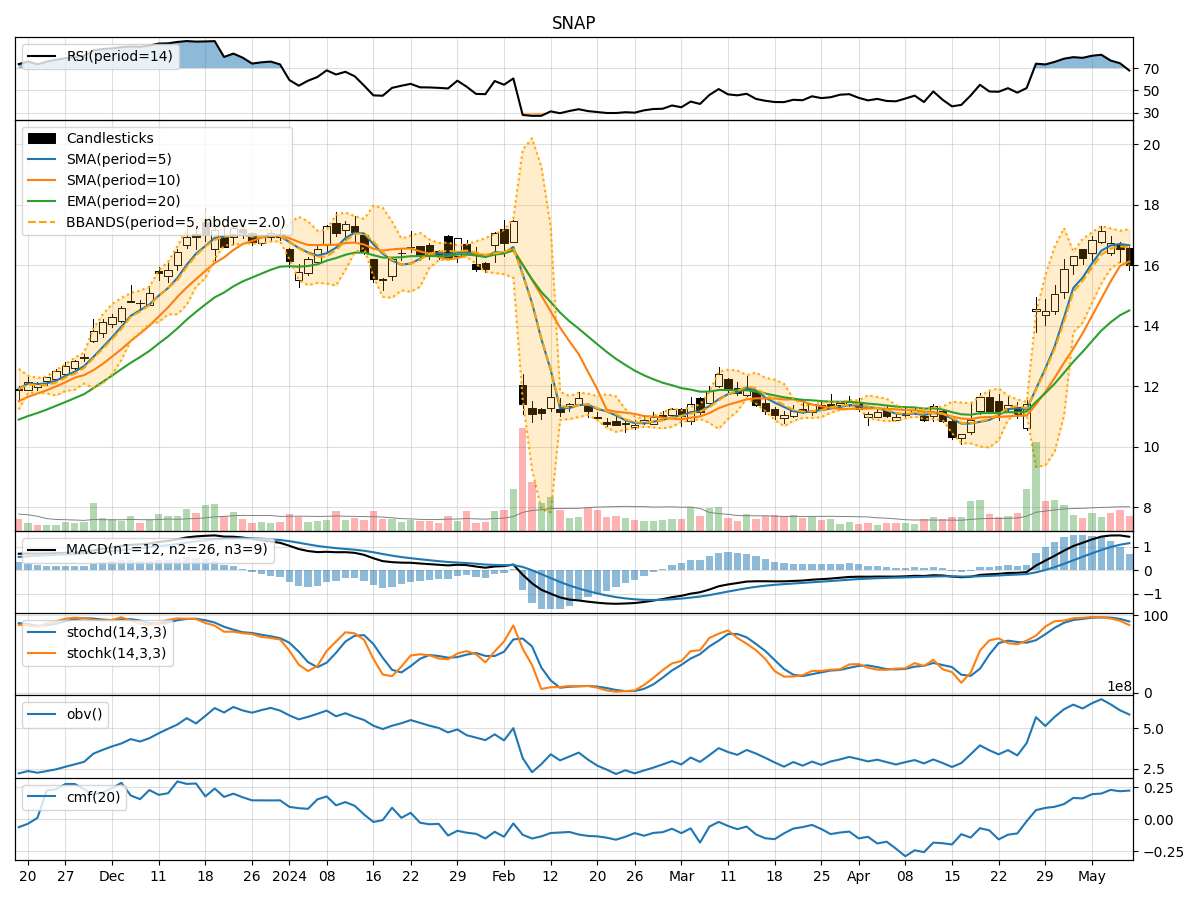
- Moving Averages (MA): The 5-day Moving Average has been consistently above the closing prices, indicating a bullish trend.
- MACD: The MACD line has been above the signal line, suggesting a bullish momentum.
- EMA: The Exponential Moving Average has been trending upwards, supporting the bullish sentiment.
Momentum Indicators:
- RSI: The Relative Strength Index has been in the overbought territory, indicating a strong bullish momentum.
- Stochastic Oscillator: Both %K and %D have been high, signaling an overbought condition.
- Williams %R: The indicator has been in the oversold region, suggesting a potential reversal.
Volatility Indicators:
- Bollinger Bands: The bands have been narrowing, indicating decreasing volatility.
- Bollinger %B: The %B has been relatively low, suggesting a possible consolidation phase.
Volume Indicators:
- On-Balance Volume (OBV): The OBV has been fluctuating, indicating mixed buying and selling pressure.
- Chaikin Money Flow (CMF): The CMF has been positive, reflecting buying pressure in the market.
Key Observations:
- The trend indicators point towards a bullish sentiment with moving averages and MACD supporting an upward trajectory.
- Momentum indicators suggest an overbought condition, which could lead to a potential pullback or consolidation phase.
- Volatility indicators show a decrease in volatility, possibly leading to a period of consolidation.
- Volume indicators indicate mixed buying and selling pressure, reflecting uncertainty in the market sentiment.
Conclusion:
Based on the analysis of the technical indicators, the next few days for SNAP could see a potential consolidation phase with a slight upward bias. Traders should be cautious of the overbought conditions highlighted by the momentum indicators and the narrowing Bollinger Bands, which may lead to a temporary pause in the upward movement. It is advisable to closely monitor key support and resistance levels for potential entry and exit points.