Technical Analysis of SKE 2024-05-10
Overview:
In analyzing the technical indicators for SKE stock over the last 5 days, we will delve into the trend, momentum, volatility, and volume indicators to provide a comprehensive outlook on the possible stock price movement in the coming days. By examining these key indicators, we aim to offer valuable insights and predictions for potential investors.
Trend Analysis:
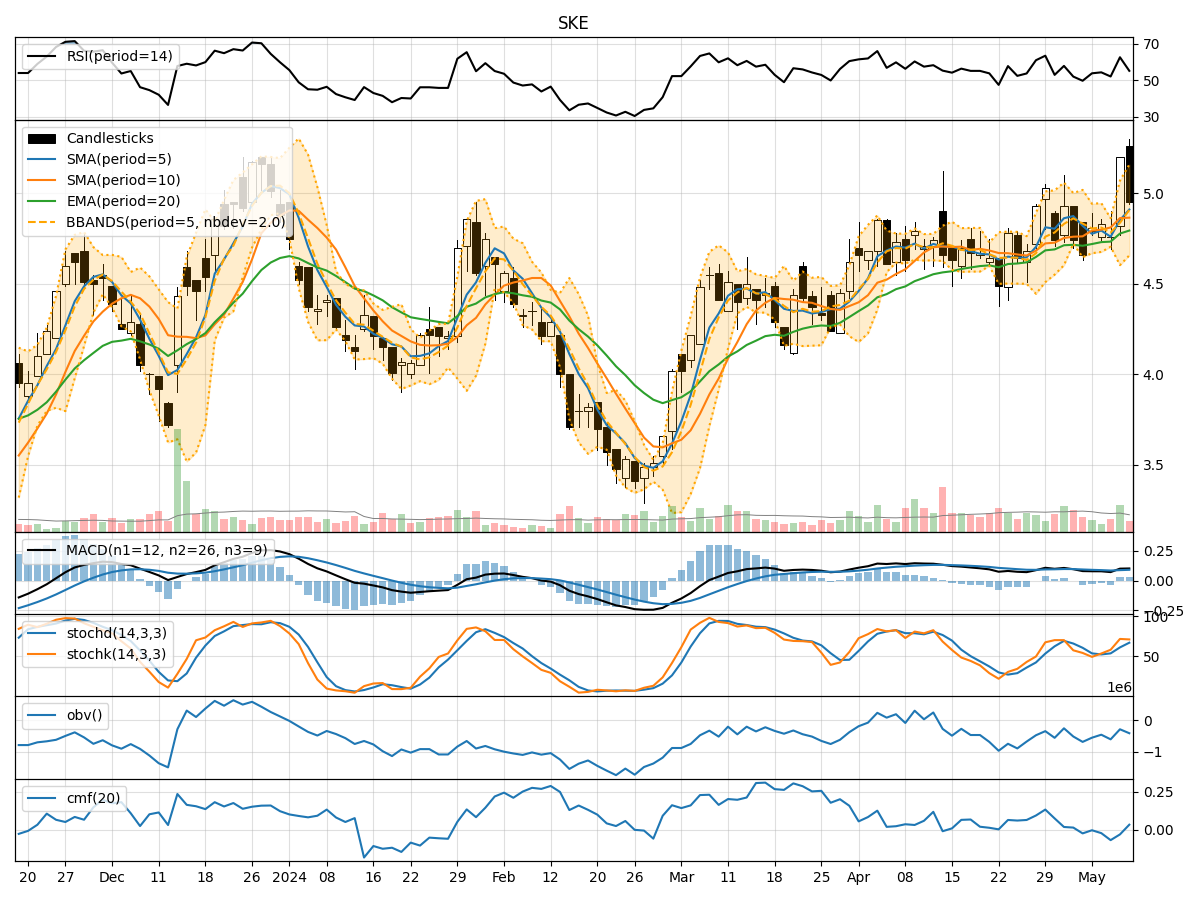
- Moving Averages (MA): The 5-day Moving Average (MA) has been fluctuating around the closing prices, indicating short-term price trends. The Simple Moving Average (SMA) and Exponential Moving Average (EMA) show a slight upward trend, suggesting a potential bullish sentiment.
- Moving Average Convergence Divergence (MACD): The MACD and Signal Line have been positive, indicating a bullish momentum in the stock price.
- Conclusion: The trend indicators suggest a bullish outlook for the stock in the near term.
Momentum Analysis:
- Relative Strength Index (RSI): The RSI has been hovering around the neutral zone, indicating a balanced momentum between buying and selling pressure.
- Stochastic Oscillator: Both %K and %D have shown fluctuations but are currently in the overbought zone, suggesting a potential reversal in the price trend.
- Williams %R (Willams %R): The Williams %R is in the oversold territory, indicating a possible buying opportunity.
- Conclusion: The momentum indicators suggest a mixed sentiment with a slight bearish bias due to the overbought conditions.
Volatility Analysis:
- Bollinger Bands (BB): The Bollinger Bands have widened, indicating increased volatility in the stock price. The current price is within the bands, suggesting a potential breakout or reversal.
- Conclusion: The volatility indicators suggest increased volatility and a potential shift in the price trend.
Volume Analysis:
- On-Balance Volume (OBV): The OBV has shown mixed movements, indicating indecision among investors regarding the stock.
- Chaikin Money Flow (CMF): The CMF has been negative, suggesting a net outflow of money from the stock.
- Conclusion: The volume indicators reflect uncertainty and a lack of strong buying or selling pressure.
Overall Conclusion:
Based on the analysis of trend, momentum, volatility, and volume indicators, the next few days' possible stock price movement for SKE is likely to be sideways with a slight bearish bias. While the trend indicators point towards a bullish sentiment, the momentum indicators signal a mixed outlook with a bearish bias due to overbought conditions. The increased volatility and lack of strong volume support further reinforce the sideways movement expectation.
Investors should closely monitor key support and resistance levels, as well as any significant news or market developments that could influence the stock price. It is advisable to exercise caution and consider a balanced approach while making trading decisions in the current market environment.