Technical Analysis of SII 2024-05-10
Overview:
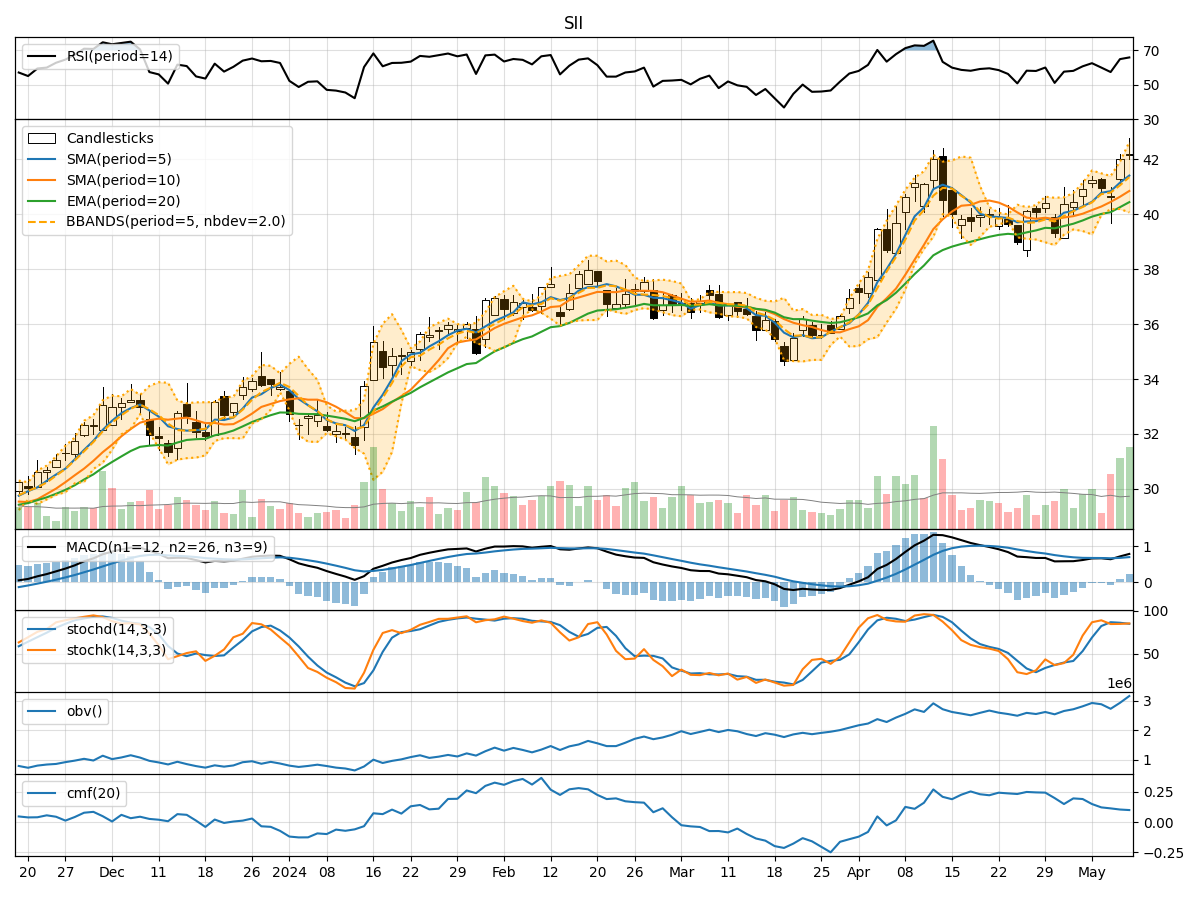
In analyzing the technical indicators for SII over the last 5 days, we will delve into the trend, momentum, volatility, and volume indicators to provide a comprehensive assessment of the stock's potential price movement. By examining these key factors, we aim to offer valuable insights and predictions for the next few days.
Trend Analysis:
- Moving Averages (MA): The 5-day Moving Average (MA) has been consistently above the Simple Moving Average (SMA) and Exponential Moving Average (EMA), indicating a bullish trend.
- MACD: The MACD line has been consistently above the signal line, suggesting a positive momentum in the stock price.
- Conclusion: The trend indicators point towards an upward trend in the stock price.
Momentum Analysis:
- RSI: The Relative Strength Index (RSI) has been fluctuating but generally staying above 50, indicating bullish momentum.
- Stochastic Oscillator: Both %K and %D have been in the overbought zone, suggesting a potential reversal.
- Conclusion: Momentum indicators suggest a bullish sentiment in the short term.
Volatility Analysis:
- Bollinger Bands (BB): The stock price has been trading within the Bollinger Bands, with the bands widening slightly, indicating increased volatility.
- Conclusion: Volatility indicators suggest a slight increase in volatility, which could lead to larger price swings.
Volume Analysis:
- On-Balance Volume (OBV): The OBV has been showing a slight increase, indicating buying pressure.
- Chaikin Money Flow (CMF): The CMF has been positive, suggesting money flow into the stock.
- Conclusion: Volume indicators point towards positive volume accumulation.
Overall Conclusion:
Based on the analysis of trend, momentum, volatility, and volume indicators, the overall outlook for SII in the next few days appears to be bullish. The stock is likely to continue its upward trend, supported by positive momentum and volume accumulation. However, traders should be cautious of the overbought levels in the stochastic oscillator, which could signal a potential pullback in the short term.
Recommendation:
Considering the bullish trend and positive momentum, investors may consider buying opportunities on pullbacks or breakouts. It is essential to set stop-loss levels to manage risk effectively. Additionally, monitoring the stochastic oscillator for potential reversal signals can help in timing entry and exit points more accurately.
In conclusion, the technical analysis suggests a bullish outlook for SII in the next few days, but traders should remain vigilant and adapt their strategies based on real-time market developments.