Technical Analysis of SHG 2024-05-10
Overview:
In analyzing the technical indicators for SHG over the last 5 days, we will delve into the trend, momentum, volatility, and volume indicators to provide a comprehensive outlook on the possible stock price movement in the coming days.
Trend Analysis:
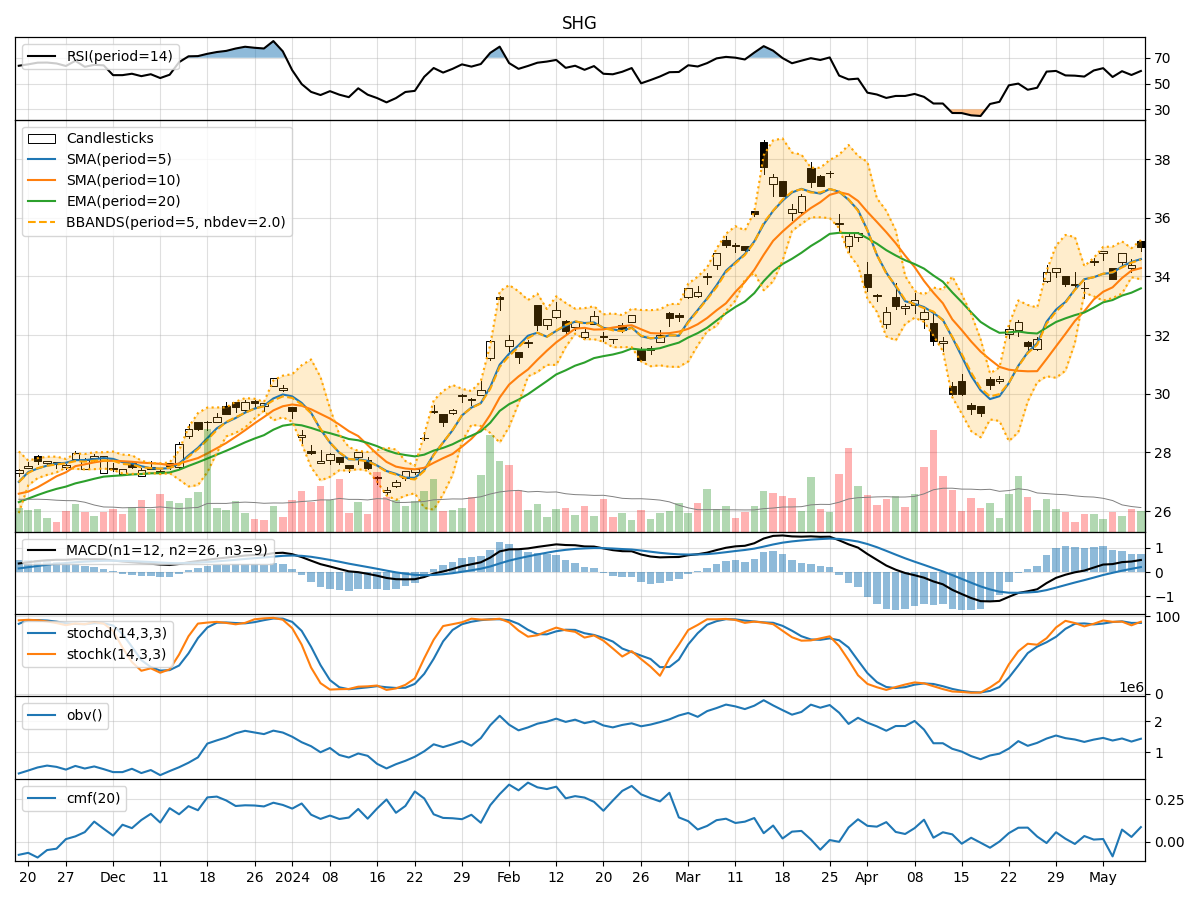
- Moving Averages (MA): The 5-day Moving Average (MA) has been consistently above the Simple Moving Average (SMA) and Exponential Moving Average (EMA), indicating a bullish trend.
- MACD: The MACD line has been consistently above the signal line, with the MACD histogram showing an increasing positive trend, suggesting bullish momentum.
Momentum Analysis:
- RSI: The Relative Strength Index (RSI) has been fluctuating around the 50 level, indicating a neutral momentum.
- Stochastic Oscillator: Both %K and %D have been in the overbought zone, suggesting a potential reversal or consolidation.
Volatility Analysis:
- Bollinger Bands (BB): The stock price has been trading within the Bollinger Bands, with the bands widening slightly, indicating increased volatility.
- Bollinger %B: The %B indicator has been fluctuating around the midline, suggesting a balanced market sentiment.
Volume Analysis:
- On-Balance Volume (OBV): The OBV has shown mixed signals, with some days experiencing selling pressure and others showing accumulation.
- Chaikin Money Flow (CMF): The CMF has been positive, indicating buying pressure in the market.
Conclusion:
Based on the analysis of the technical indicators: - Trend: The stock is in an upward trend based on moving averages and MACD. - Momentum: The momentum is neutral based on RSI and stochastic oscillator. - Volatility: Volatility has increased slightly based on Bollinger Bands. - Volume: The volume indicators suggest mixed signals with some accumulation and selling pressure.
Possible Stock Price Movement:
Considering the overall analysis, the stock is likely to continue its upward trend in the coming days, supported by the bullish signals from the trend indicators. However, caution is advised as the momentum is neutral, and there might be a potential consolidation or pullback in the short term due to overbought conditions indicated by the stochastic oscillator.
Recommendation:
- Short-term: Consider taking profits if the stock price reaches overbought levels.
- Long-term: Hold the position with a stop-loss to protect gains in case of a reversal.
- Monitoring: Keep a close eye on the momentum indicators for any signs of a trend reversal.
Always remember to combine technical analysis with fundamental analysis and market news for a holistic view before making any investment decisions.