Technical Analysis of SBSW 2024-05-10
Overview:
In analyzing the technical indicators for SBSW over the last 5 days, we will delve into the trend, momentum, volatility, and volume indicators to provide a comprehensive outlook on the possible stock price movement in the coming days. By examining these key aspects, we aim to offer valuable insights and predictions for potential investors.
Trend Analysis:
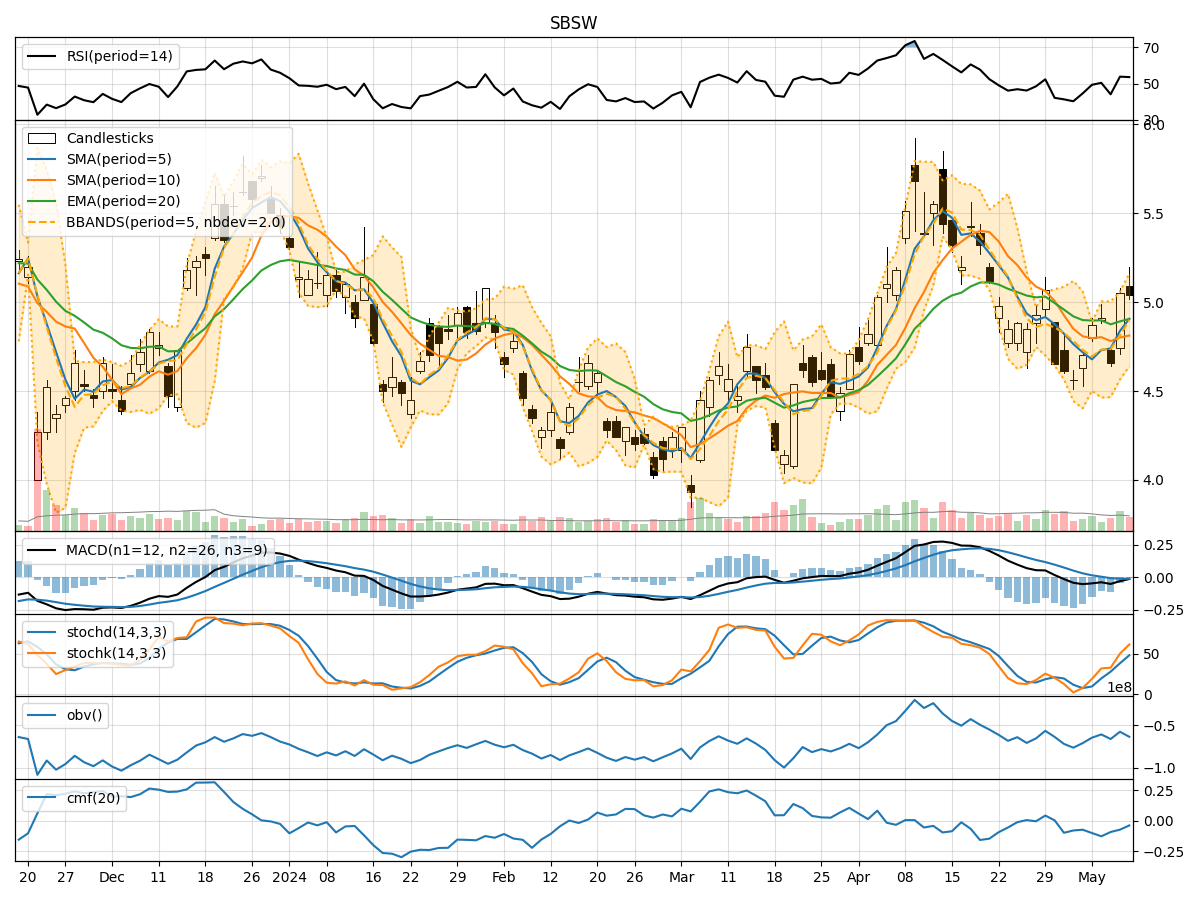
- Moving Averages (MA): The 5-day Moving Average (MA) has been fluctuating around the closing prices, indicating short-term price trends. The Simple Moving Average (SMA) and Exponential Moving Average (EMA) show a downward trend, suggesting a bearish sentiment.
- MACD: The Moving Average Convergence Divergence (MACD) has been negative, with the MACD line consistently below the signal line. This indicates a bearish momentum in the stock price.
Momentum Analysis:
- RSI: The Relative Strength Index (RSI) has been hovering around the neutral zone, indicating a lack of strong momentum in either direction.
- Stochastic Oscillator: Both %K and %D values have been fluctuating, showing indecision in the market momentum.
- Williams %R: The Williams %R is also near the oversold region, suggesting a potential reversal in the stock price.
Volatility Analysis:
- Bollinger Bands (BB): The Bollinger Bands have been narrowing, indicating decreasing volatility in the stock price. The bands are squeezing, which could lead to a breakout in either direction.
- Bollinger %B: The %B indicator shows the stock price is currently trading closer to the lower band, suggesting a possible oversold condition.
Volume Analysis:
- On-Balance Volume (OBV): The OBV has been fluctuating, indicating mixed buying and selling pressure in the stock.
- Chaikin Money Flow (CMF): The CMF has been negative, suggesting outflow of money from the stock.
Conclusion:
Based on the analysis of the technical indicators, the stock of SBSW is currently exhibiting bearish signals in the short term. The trend indicators, momentum oscillators, and volume indicators all point towards a potential downward movement in the stock price. The narrowing Bollinger Bands and negative CMF further support this bearish view.
Recommendation:
Considering the overall technical outlook, it is advisable to exercise caution when trading or investing in SBSW in the coming days. Traders may consider short-term bearish strategies or wait for a clearer signal before taking any significant positions. It is essential to monitor the price action closely and be prepared to adapt to changing market conditions.