Technical Analysis of SAND 2024-05-10
Overview:
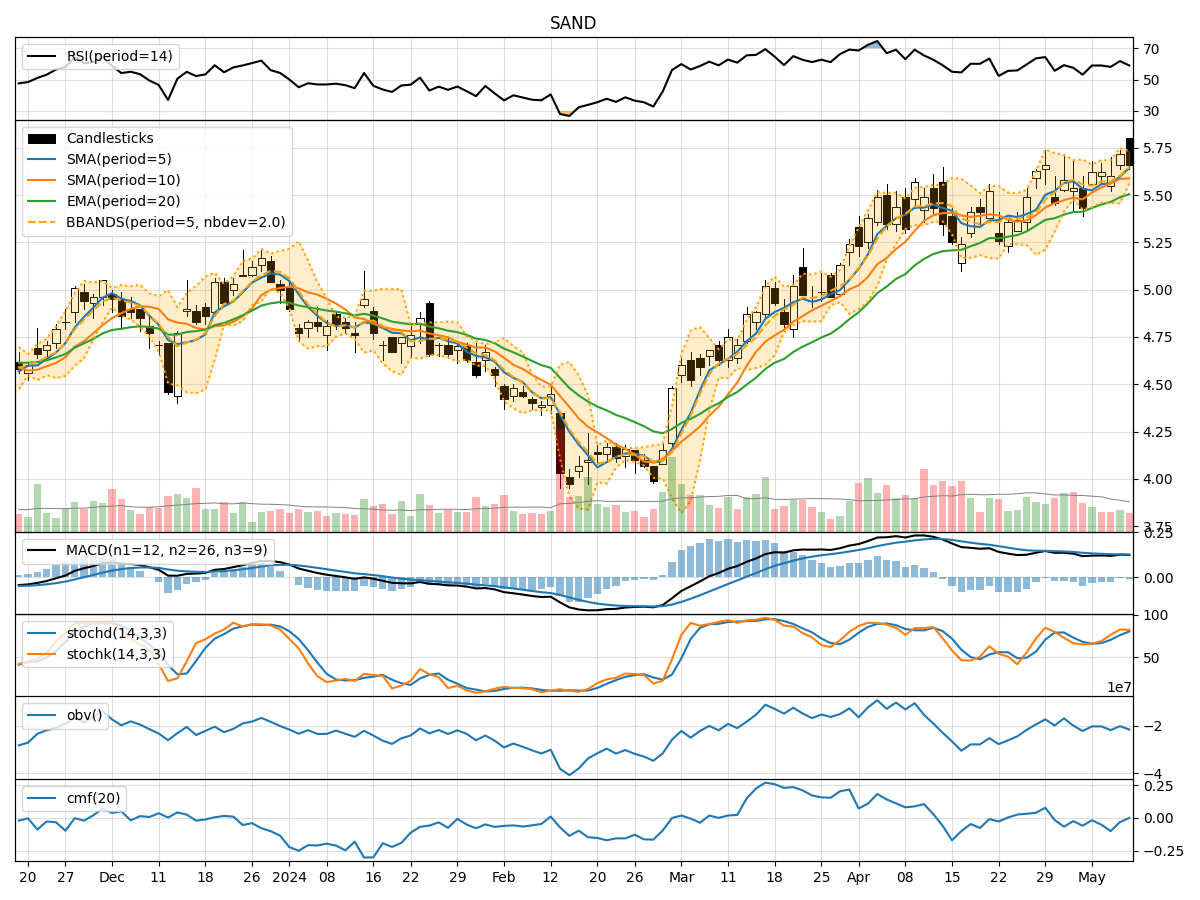
In analyzing the technical indicators for SAND over the last 5 days, we will delve into the trend, momentum, volatility, and volume indicators to provide a comprehensive assessment of the stock's potential price movement. By examining these key factors, we aim to offer valuable insights and predictions for the next few days.
Trend Analysis:
- Moving Averages (MA): The 5-day Moving Average (MA) has been trending above the Simple Moving Average (SMA) and Exponential Moving Average (EMA), indicating a short-term bullish trend.
- MACD: The MACD line has been consistently above the signal line, suggesting positive momentum in the stock price.
- MACD Histogram: The MACD Histogram has been hovering around zero, indicating a potential consolidation phase.
Momentum Analysis:
- RSI: The Relative Strength Index (RSI) has been fluctuating around the neutral level of 50, indicating a lack of strong momentum in either direction.
- Stochastic Oscillator: Both %K and %D lines of the Stochastic Oscillator have been in the overbought territory, suggesting a possible reversal or consolidation.
- Williams %R: The Williams %R is in the oversold region, indicating a potential buying opportunity.
Volatility Analysis:
- Bollinger Bands: The Bollinger Bands have shown a narrowing of the bands, indicating decreasing volatility and a potential price breakout in the near future.
- Bollinger %B: The %B indicator is below 1, suggesting the stock price is trading below the lower Bollinger Band, potentially indicating an oversold condition.
Volume Analysis:
- On-Balance Volume (OBV): The OBV has shown mixed signals with fluctuations in volume, indicating indecision among market participants.
- Chaikin Money Flow (CMF): The CMF has been negative, indicating selling pressure in the stock.
Conclusion:
Based on the analysis of the technical indicators, the stock price of SAND is likely to experience sideways movement in the next few days. The lack of strong momentum, coupled with mixed signals from volume indicators, suggests a period of consolidation. Traders may expect the stock to trade within a range with limited upside or downside potential. It is advisable to closely monitor key support and resistance levels for potential breakout opportunities.