Technical Analysis of SAN 2024-05-10
Overview:
In analyzing the technical indicators for SAN over the last 5 days, we will delve into the trend, momentum, volatility, and volume indicators to provide a comprehensive outlook on the possible stock price movement in the coming days. By examining these key aspects, we aim to offer valuable insights and recommendations for potential investors.
Trend Analysis:
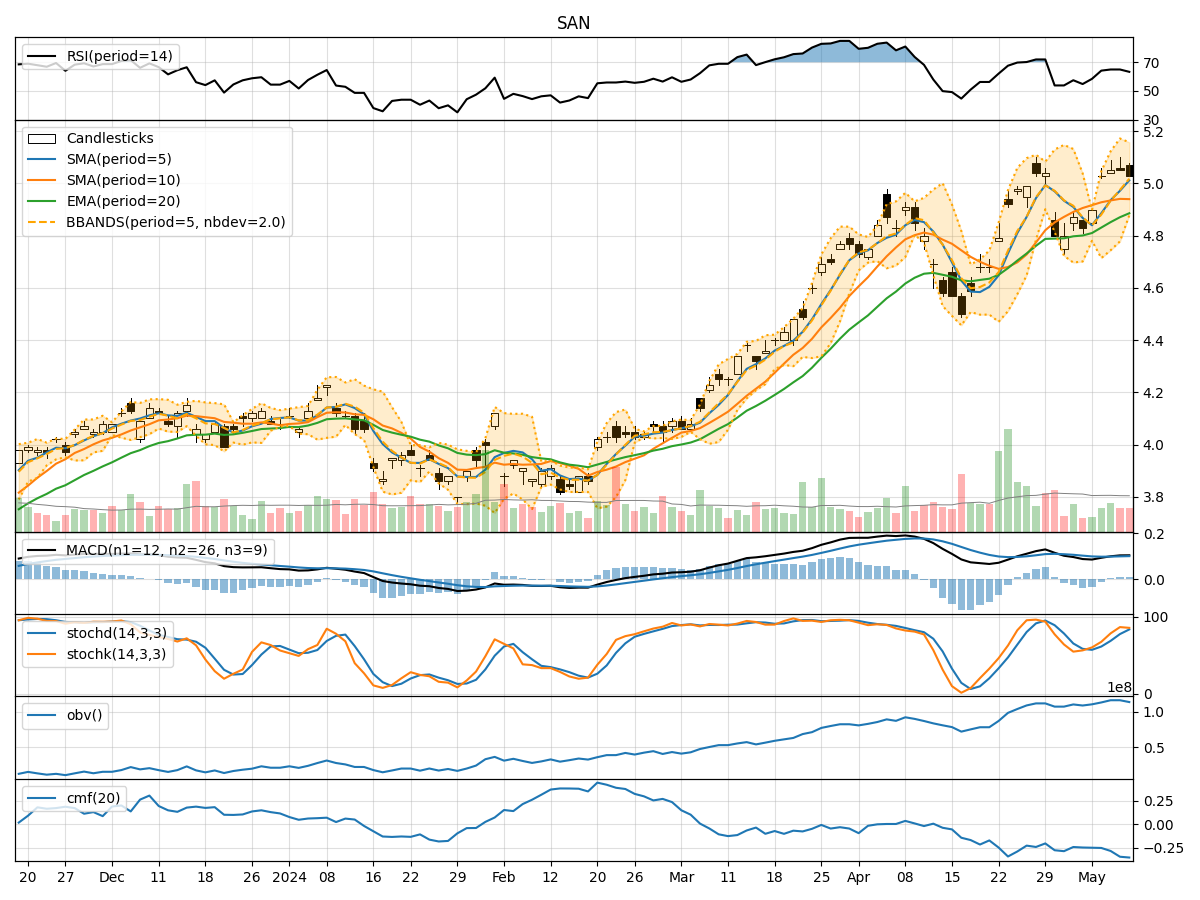
- Moving Averages (MA): The 5-day Moving Average (MA) has been consistently increasing, indicating a bullish trend in the short term.
- MACD and Signal Line: The MACD line has been above the Signal line, suggesting positive momentum in the stock price.
- Relative Strength Index (RSI): The RSI has been fluctuating around the 60-65 range, indicating a neutral to slightly bullish sentiment.
Momentum Analysis:
- Stochastic Oscillator: Both %K and %D lines of the Stochastic Oscillator have been in the overbought zone, signaling a potential reversal or consolidation.
- Williams %R (WillR): The Williams %R has been hovering in the oversold territory, indicating a possible buying opportunity.
Volatility Analysis:
- Bollinger Bands (BB): The stock price has been trading within the Bollinger Bands, suggesting a period of consolidation.
- Bollinger Band Width (BBW): The Band Width has been narrowing, indicating decreasing volatility in the stock.
Volume Analysis:
- On-Balance Volume (OBV): The OBV has been relatively stable, indicating a balance between buying and selling pressure.
- Chaikin Money Flow (CMF): The CMF has been negative, suggesting a bearish money flow in the stock.
Key Observations:
- The stock is currently in a short-term bullish trend based on moving averages and MACD.
- Momentum indicators show conflicting signals with Stochastic in overbought territory and Williams %R in oversold territory.
- Volatility is decreasing, indicating a potential period of consolidation.
- Volume indicators suggest a bearish money flow in the stock.
Conclusion:
Based on the analysis of technical indicators, the next few days' possible stock price movement for SAN is likely to be sideways with a slight bearish bias. Investors should exercise caution and wait for clearer signals from momentum indicators before making significant trading decisions. It is advisable to monitor the stock closely for any potential reversal patterns or breakout signals that could indicate a change in the current trend.