Technical Analysis of RVTY 2024-05-10
Overview:
In analyzing the technical indicators for RVTY stock over the last 5 days, we will delve into the trend, momentum, volatility, and volume indicators to provide a comprehensive outlook on the possible stock price movement in the coming days. By examining these key indicators, we aim to offer valuable insights and predictions for informed decision-making.
Trend Analysis:
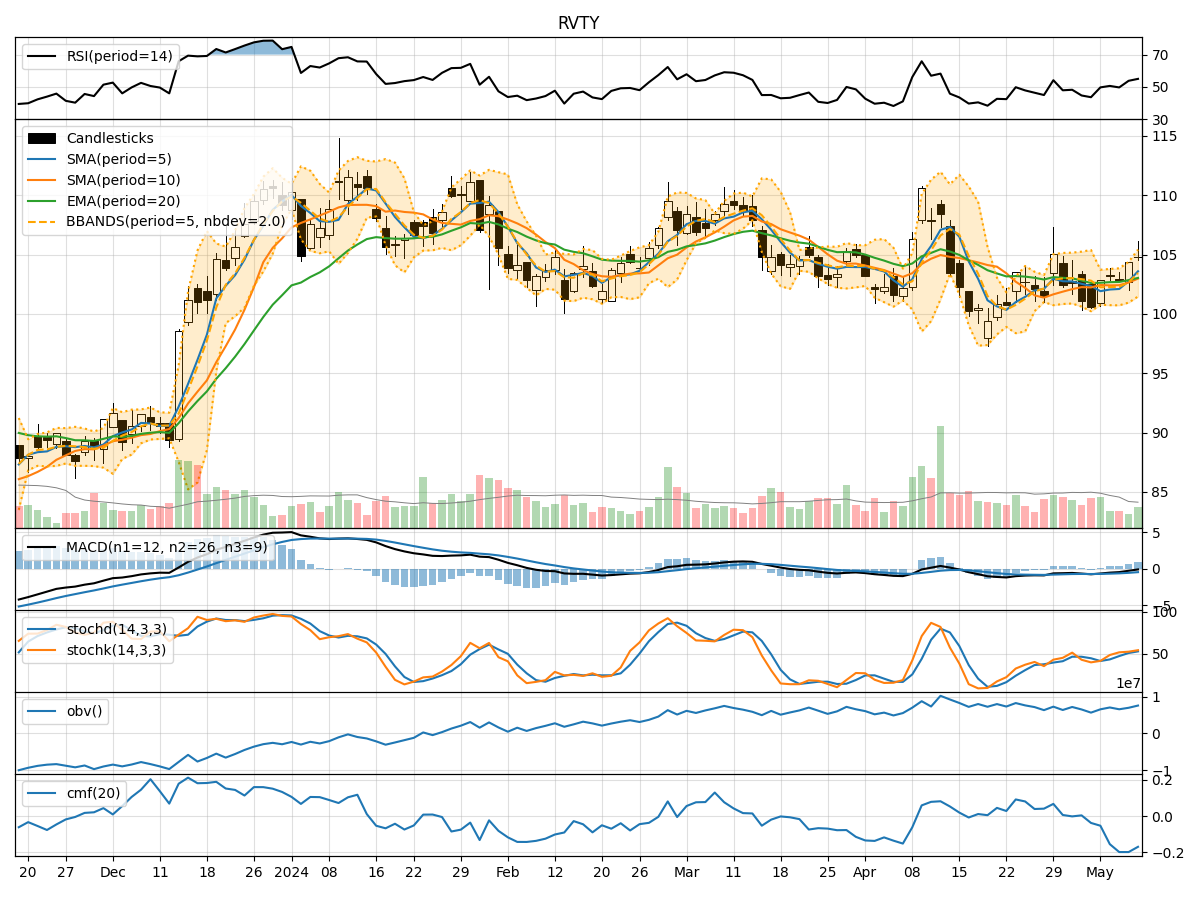
- Moving Averages (MA): The 5-day Moving Average (MA) has been trending upwards, indicating a positive short-term trend in the stock price.
- MACD: The Moving Average Convergence Divergence (MACD) has shown a positive trend with the MACD line consistently above the signal line, suggesting bullish momentum.
- EMA: The Exponential Moving Average (EMA) has been on an upward trajectory, further supporting the bullish sentiment in the stock.
Momentum Analysis:
- RSI: The Relative Strength Index (RSI) has been fluctuating around the neutral zone, indicating a balanced momentum in the stock.
- Stochastic Oscillator: The Stochastic Oscillator reflects a slightly overbought condition but has not reached extreme levels, suggesting potential for further upside.
- Williams %R: The Williams %R indicator shows the stock is not in oversold or overbought territory, indicating a balanced momentum.
Volatility Analysis:
- Bollinger Bands: The Bollinger Bands have been widening, indicating increased volatility in the stock price.
- Volatility Bands: The Volatility Bands have shown an expansion, suggesting potential price swings in the coming days.
Volume Analysis:
- On-Balance Volume (OBV): The OBV indicator has been relatively stable, showing a neutral volume trend.
- Chaikin Money Flow (CMF): The CMF has been negative, indicating some selling pressure in the stock.
Key Observations:
- The trend indicators suggest a bullish sentiment in the stock, supported by moving averages and MACD.
- Momentum indicators show a balanced momentum with potential for further upside based on stochastic and Williams %R.
- Volatility indicators point towards increased price fluctuations, which could lead to both upside and downside movements.
- Volume indicators reflect neutral volume trends with a slight selling pressure based on CMF.
Conclusion:
Based on the analysis of the technical indicators, the overall outlook for RVTY stock in the next few days is bullish. The trend indicators, momentum indicators, and volatility indicators collectively suggest a potential for upward movement in the stock price. However, it is essential to monitor the volatility closely as it could lead to sharp price swings. Traders and investors should consider entering long positions with appropriate risk management strategies to capitalize on the expected bullish momentum in RVTY stock.