Technical Analysis of RTO 2024-05-10
Overview:
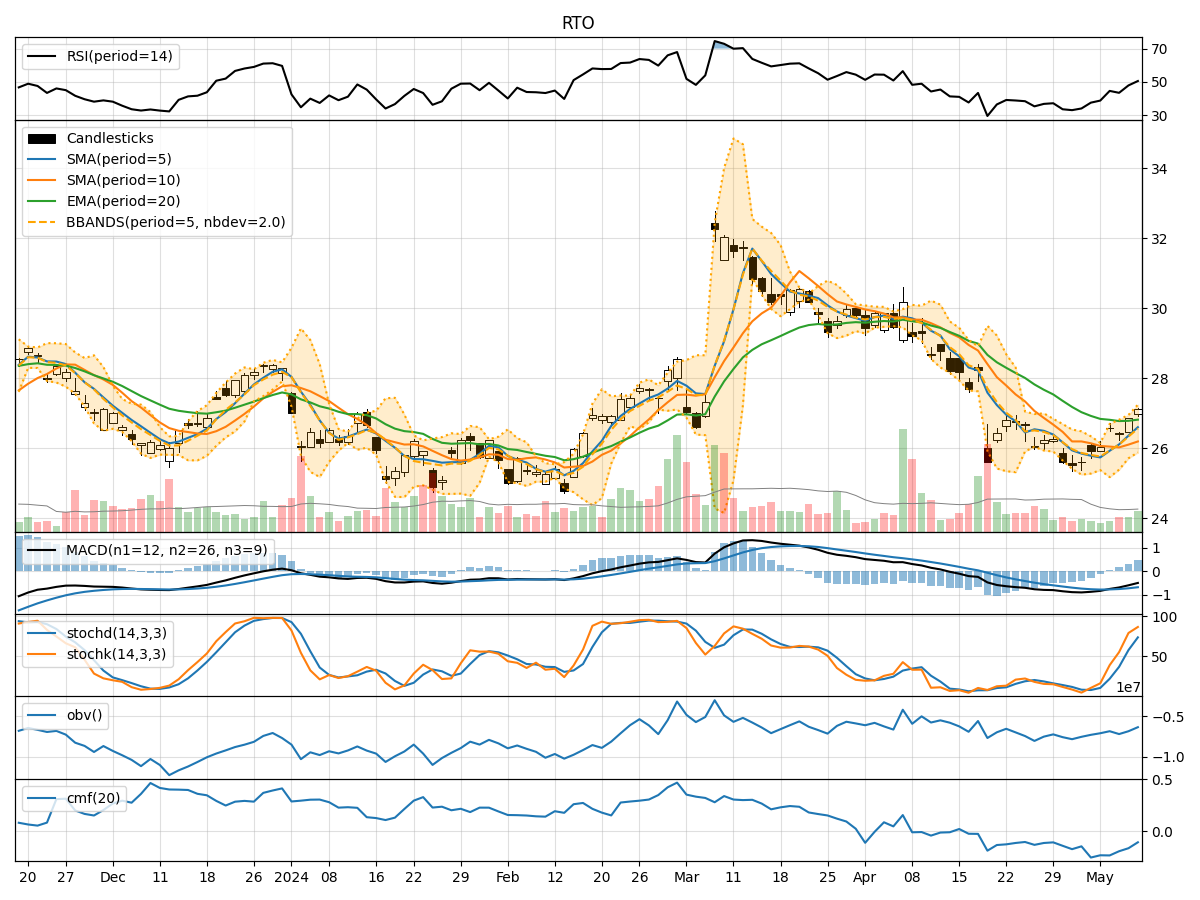
In analyzing the technical indicators for RTO stock over the last 5 days, we will delve into the trends, momentum, volatility, and volume aspects to provide a comprehensive outlook on the possible stock price movement in the coming days.
Trend Analysis:
- Moving Averages (MA): The 5-day Moving Average (MA) has been consistently rising, indicating a bullish trend in the short term.
- MACD: The Moving Average Convergence Divergence (MACD) has shown a positive trend with the MACD line consistently above the signal line, suggesting bullish momentum.
- EMA: The Exponential Moving Average (EMA) has been trending upwards, supporting the bullish sentiment in the market.
Momentum Analysis:
- RSI: The Relative Strength Index (RSI) has been gradually increasing, indicating strengthening buying momentum.
- Stochastic Oscillator: Both %K and %D lines of the Stochastic Oscillator are in the overbought zone, suggesting a potential reversal or consolidation.
- Williams %R: The Williams %R is close to the oversold territory, indicating a possible buying opportunity.
Volatility Analysis:
- Bollinger Bands: The Bollinger Bands are widening, indicating increased volatility in the stock price.
- Bollinger %B: The %B indicator is hovering around 0.85, suggesting the stock is trading near the upper band, potentially overbought.
Volume Analysis:
- On-Balance Volume (OBV): The OBV indicator has been fluctuating, indicating mixed buying and selling pressure.
- Chaikin Money Flow (CMF): The CMF is negative, suggesting a lack of buying interest in the stock.
Key Observations:
- The trend indicators point towards a bullish sentiment in the short term.
- Momentum indicators show a potential overbought scenario, signaling a need for caution.
- Volatility has increased, indicating potential price swings.
- Volume indicators suggest a lack of strong buying interest.
Conclusion:
Based on the analysis of the technical indicators, the next few days' possible stock price movement for RTO is likely to be sideways to slightly bullish. While the trend indicators support a bullish outlook, the overbought signals from momentum indicators and lack of strong buying volume may lead to a consolidation phase or a minor pullback in the stock price. Traders should closely monitor key support and resistance levels for potential entry or exit points.