Technical Analysis of RSG 2024-05-10
Overview:
In analyzing the technical indicators for RSG stock over the last 5 days, we will delve into the trend, momentum, volatility, and volume indicators to provide a comprehensive outlook on the possible future stock price movement. By examining these key indicators, we aim to offer valuable insights and predictions for the upcoming trading days.
Trend Analysis:
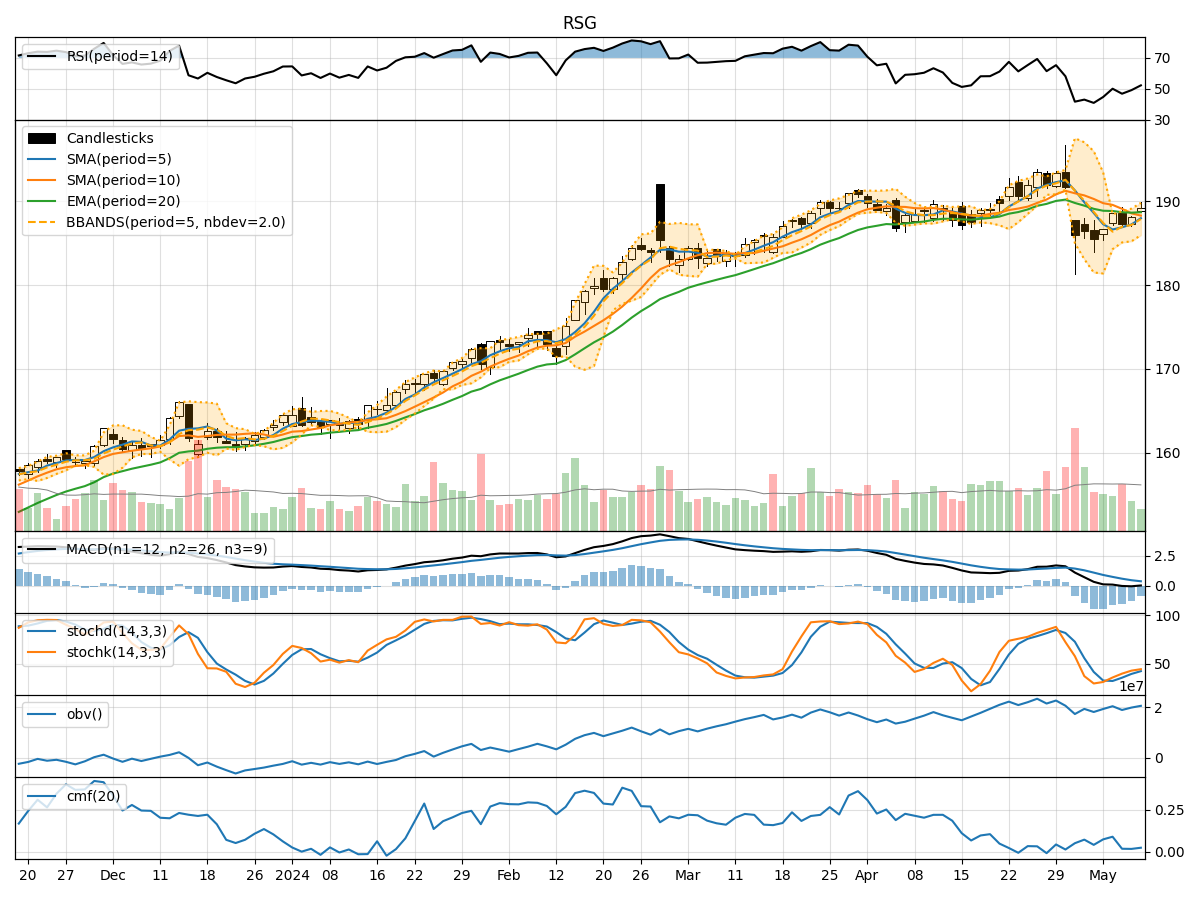
- Moving Averages (MA): The 5-day Moving Average (MA) has been fluctuating around the closing prices, indicating short-term price trends. The Simple Moving Average (SMA) and Exponential Moving Average (EMA) show a slight downward trend, suggesting a potential bearish sentiment in the short term.
- MACD: The Moving Average Convergence Divergence (MACD) line has been consistently below the signal line, indicating a bearish trend. The MACD Histogram has been decreasing, further supporting the bearish outlook.
Momentum Analysis:
- RSI: The Relative Strength Index (RSI) has been hovering around the neutral zone, indicating a lack of strong momentum in either direction.
- Stochastic Oscillator: Both %K and %D lines of the Stochastic Oscillator have been moving upwards but remain below the overbought threshold, suggesting a potential uptrend in momentum.
Volatility Analysis:
- Bollinger Bands (BB): The Bollinger Bands have been narrowing, indicating decreasing volatility in the stock price. The bands are currently close to each other, suggesting a period of consolidation.
- Bollinger %B: The %B indicator is below 1, indicating that the stock price is trading below the upper Bollinger Band, which could signal a potential reversal or consolidation phase.
Volume Analysis:
- On-Balance Volume (OBV): The OBV indicator has been relatively stable, showing a slight increase in volume over the last few days. This could suggest some accumulation by investors.
- Chaikin Money Flow (CMF): The CMF has been positive but relatively flat, indicating a neutral sentiment towards the stock in terms of buying pressure.
Conclusion:
Based on the analysis of the technical indicators, the stock price of RSG is likely to experience sideways movement in the next few days. The trend indicators point towards a bearish bias in the short term, supported by the MACD and moving averages. However, the momentum indicators suggest a potential uptick in buying pressure, as indicated by the Stochastic Oscillator.
The volatility analysis indicates a decreasing volatility environment, which could lead to a period of consolidation. The volume indicators show a neutral stance with a slight increase in volume, suggesting a balanced market sentiment.
In conclusion, while the trend indicators lean towards a bearish outlook, the momentum indicators hint at a possible reversal. Therefore, investors should closely monitor the price action and key support/resistance levels for potential trading opportunities.