Technical Analysis of RLX 2024-05-10
Overview:
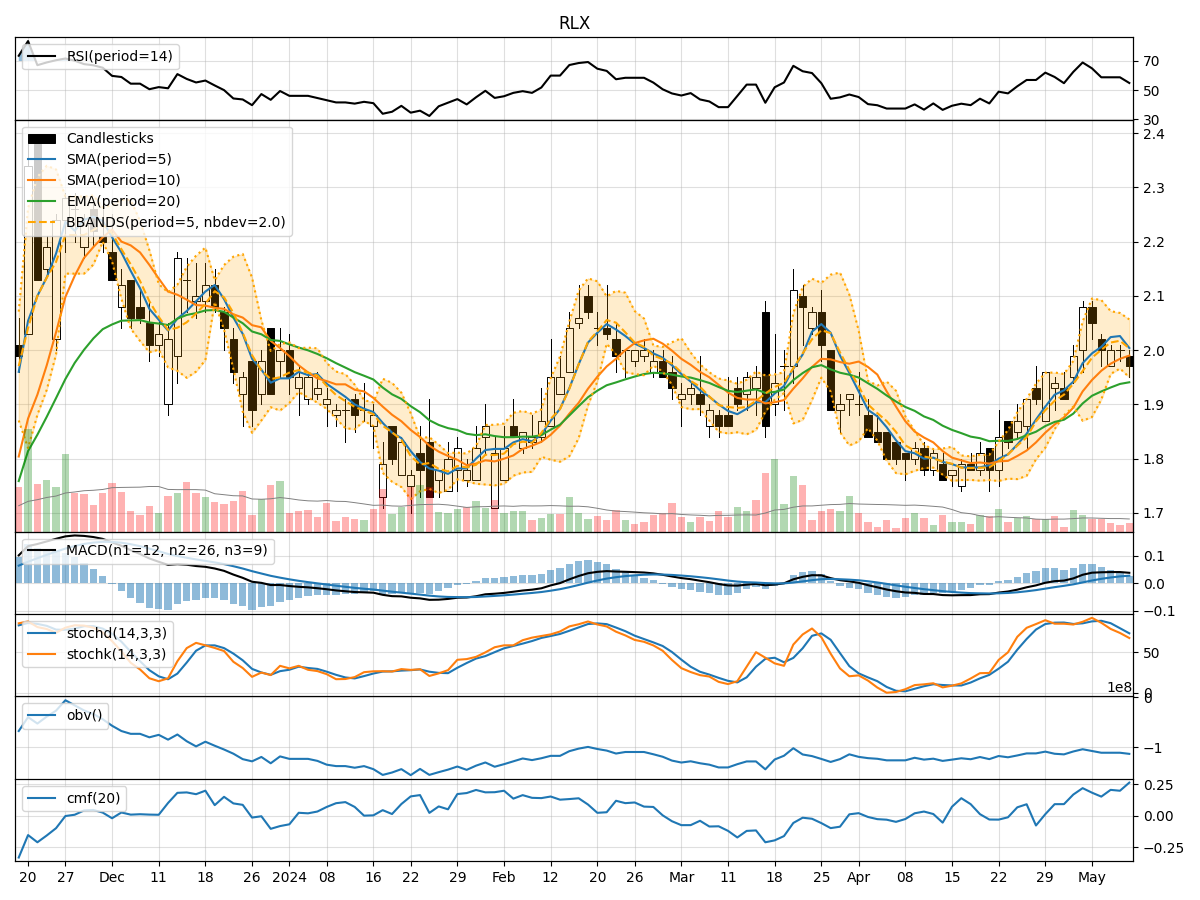
In analyzing the technical indicators for RLX over the last 5 days, we will delve into the trend, momentum, volatility, and volume indicators to provide a comprehensive outlook on the possible stock price movement. By examining these key aspects, we aim to offer valuable insights and predictions for the upcoming trading days.
Trend Analysis:
- Moving Averages (MA): The 5-day Moving Average (MA) has been fluctuating around the 2.00 mark, indicating a relatively stable price trend.
- MACD: The MACD line has shown a slight increase over the past days, suggesting a potential bullish momentum.
- EMA: The Exponential Moving Average (EMA) has been on an upward trajectory, reflecting a positive trend in the stock price.
Momentum Analysis:
- RSI: The Relative Strength Index (RSI) has been gradually decreasing, indicating a weakening momentum.
- Stochastic Oscillator: Both %K and %D values have been declining, signaling a bearish momentum.
- Williams %R: The Williams %R indicator has been in the oversold territory, suggesting a potential reversal in the stock price.
Volatility Analysis:
- Bollinger Bands: The Bollinger Bands have been narrowing, indicating decreasing volatility in the stock price.
- Bollinger %B: The %B value has been relatively low, suggesting a possible consolidation phase.
- Average True Range (ATR): The ATR has shown a decrease, indicating reduced price volatility.
Volume Analysis:
- On-Balance Volume (OBV): The OBV has been fluctuating, reflecting mixed buying and selling pressure.
- Chaikin Money Flow (CMF): The CMF has shown an increasing trend, indicating potential accumulation by investors.
Key Observations:
- The stock price has been consolidating around the 2.00 mark, with minor fluctuations.
- Momentum indicators suggest a weakening bullish momentum.
- Volatility has been decreasing, indicating a potential period of consolidation.
- Volume indicators show mixed signals, with fluctuating buying and selling pressure.
Conclusion:
Based on the analysis of the technical indicators, the next few days for RLX stock may see sideways movement with a slight bearish bias. Investors should exercise caution and closely monitor key support and resistance levels. Consider implementing risk management strategies to navigate potential price fluctuations effectively.