Technical Analysis of RJF 2024-05-10
Overview:
In analyzing the technical indicators for RJF over the last 5 days, we will delve into the trend, momentum, volatility, and volume indicators to provide a comprehensive outlook on the possible stock price movement in the coming days. By examining these key aspects, we aim to offer valuable insights and predictions for informed decision-making.
Trend Indicators:
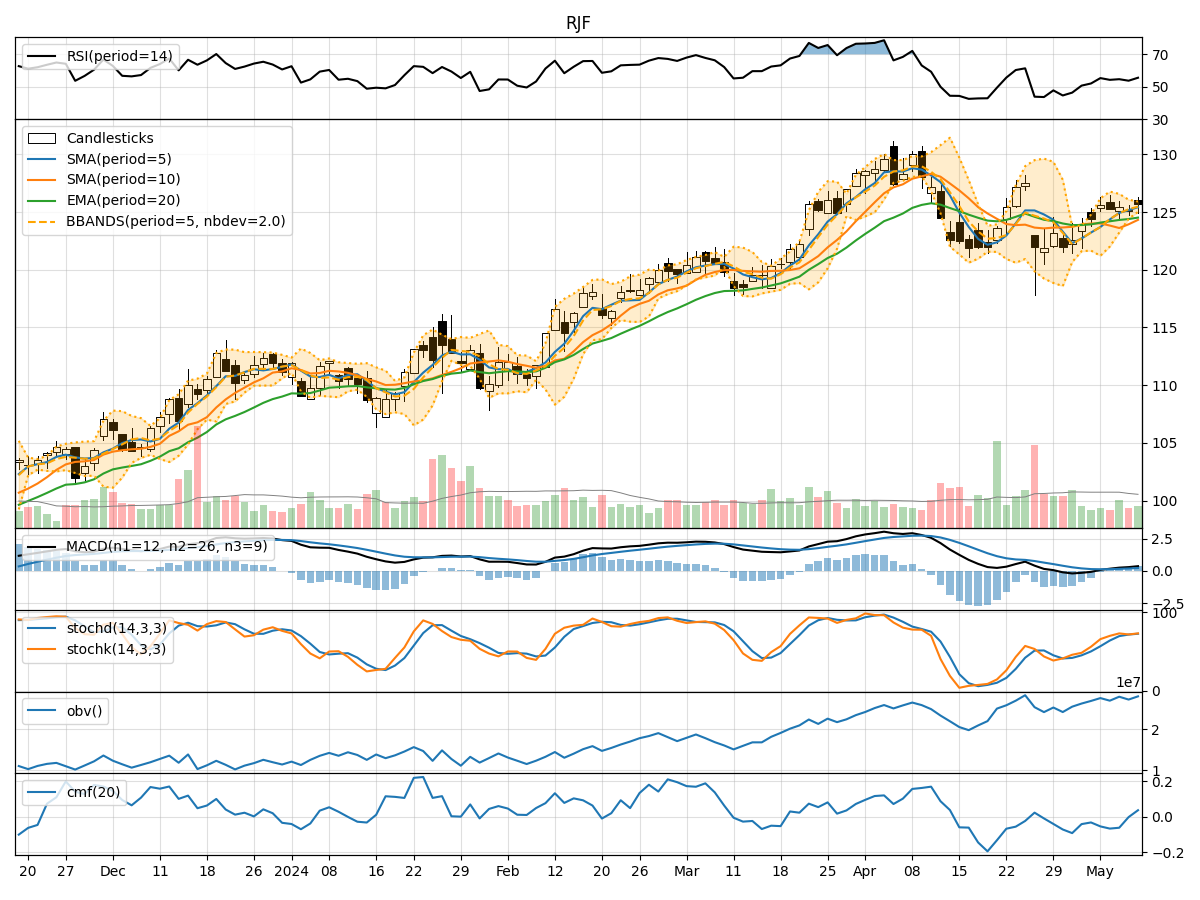
- Moving Averages (MA): The 5-day MA has been consistently above the closing prices, indicating a short-term uptrend.
- MACD: The MACD line has been trending upwards, with the MACD histogram showing increasing positive values, suggesting bullish momentum.
- EMA: The EMA has been steadily rising, supporting the bullish trend.
Momentum Indicators:
- RSI: The RSI has been fluctuating around the neutral zone, indicating indecision in the market.
- Stochastic Oscillator: Both %K and %D have been in the overbought territory, signaling a potential reversal.
- Williams %R: The indicator has been hovering in the oversold region, suggesting a possible buying opportunity.
Volatility Indicators:
- Bollinger Bands (BB): The bands have been narrowing, indicating decreasing volatility and a potential breakout.
- BB% (Bollinger Band %B): The %B has been fluctuating within a tight range, reflecting consolidation.
- BBW (Bollinger Band Width): The narrowing width suggests a period of low volatility.
Volume Indicators:
- On-Balance Volume (OBV): The OBV has shown mixed signals, reflecting uncertainty in the accumulation/distribution of the stock.
- Chaikin Money Flow (CMF): The CMF has been negative, indicating selling pressure in the market.
Key Observations and Opinions:
- Trend: The trend indicators suggest a bullish bias in the short term, supported by the moving averages and MACD.
- Momentum: Mixed signals from the momentum indicators imply a potential shift in market sentiment.
- Volatility: Decreasing volatility as indicated by the Bollinger Bands may precede a period of consolidation or a breakout.
- Volume: The volume indicators reflect a lack of strong buying or selling pressure, contributing to the overall uncertainty in the market.
Conclusion:
Based on the analysis of the technical indicators, the next few days for RJF could see sideways movement with a slight bullish bias. Traders should closely monitor key levels such as the support and resistance zones identified by the trend and volatility indicators. Additionally, keeping an eye on the momentum indicators for any signs of a reversal or continuation of the current trend is crucial for making informed trading decisions. It is advisable to wait for confirmation from multiple indicators before taking significant positions in the stock.