Technical Analysis of REX 2024-05-10
Overview:
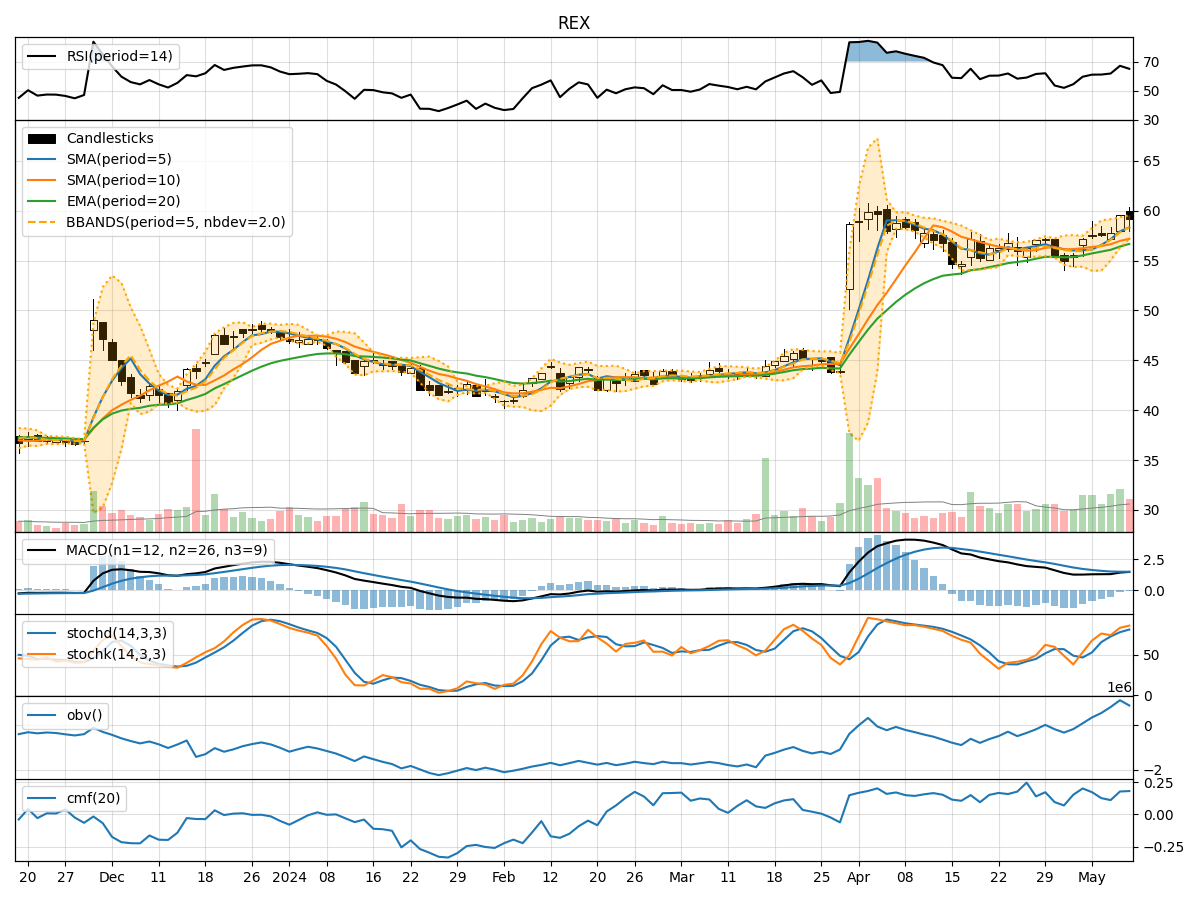
In the last 5 trading days, REX stock has shown a consistent uptrend in both price and volume. The moving averages have been trending upwards, indicating a bullish sentiment. Momentum indicators like RSI and Stochastic oscillators suggest the stock is in overbought territory. Volatility indicators show a slight increase, possibly indicating increased price fluctuations. Volume indicators also confirm the uptrend with rising OBV and CMF values.
Trend Analysis:
- Moving Averages (MA): The 5-day MA has been consistently above the 10-day SMA, indicating a short-term bullish trend. The EMA(20) is also trending upwards, supporting the bullish sentiment.
- MACD: The MACD line has been above the signal line for the past 5 days, indicating positive momentum. The MACD histogram has been decreasing but remains in positive territory, suggesting a potential slowdown in momentum.
Momentum Analysis:
- RSI: The RSI has been above 70 for the last few days, indicating overbought conditions. This could potentially lead to a pullback or consolidation in the stock price.
- Stochastic Oscillators: Both %K and %D have been in the overbought zone, suggesting a possible reversal or correction in the near future.
- Williams %R (WillR): The Williams %R is also in the overbought region, indicating a potential downward movement.
Volatility Analysis:
- Bollinger Bands (BB): The Bollinger Bands have been widening slightly, indicating increased volatility. The current price is close to the upper band, suggesting a possible reversal or correction.
Volume Analysis:
- On-Balance Volume (OBV): The OBV has been steadily increasing, confirming the uptrend in the stock. This indicates that volume is supporting the price movement.
- Chaikin Money Flow (CMF): The CMF has been positive for the last 5 days, indicating buying pressure in the stock.
Conclusion:
Based on the technical indicators and analysis: - Trend: The stock is in a strong upward trend. - Momentum: The stock is currently overbought and may experience a pullback or consolidation in the short term. - Volatility: Increased volatility suggests potential price fluctuations and a possible reversal. - Volume: Strong volume support indicates a continuation of the uptrend.
Overall Opinion:
Given the overbought conditions in momentum indicators and the proximity to the upper Bollinger Band, a short-term correction or consolidation is likely. However, the overall trend remains bullish, and any pullback could present a buying opportunity for investors looking to enter the stock for the long term. Exercise caution in the short term but maintain a bullish outlook for the stock in the medium to long term.