Technical Analysis of RERE 2024-05-10
Overview:
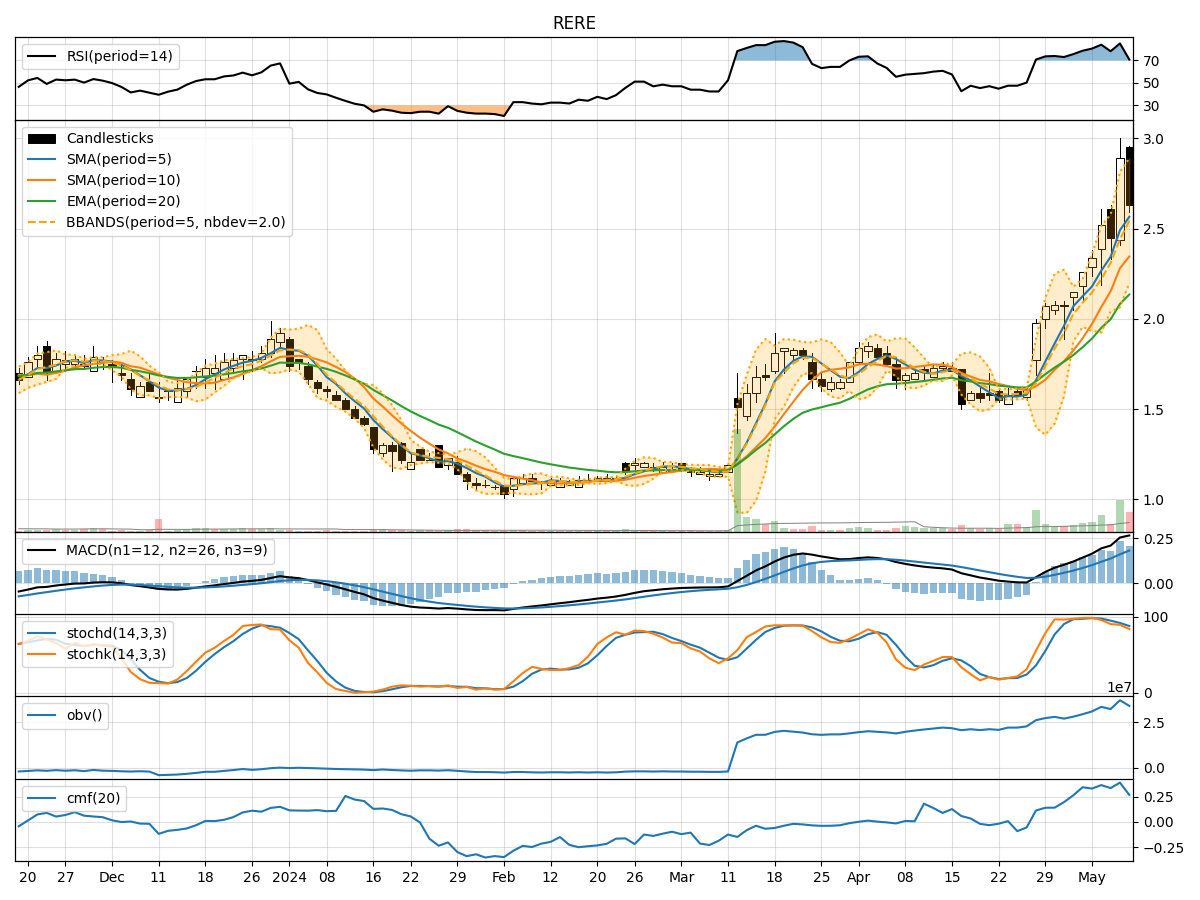
In analyzing the technical indicators for RERE stock over the last 5 days, we will delve into the trend, momentum, volatility, and volume indicators to provide a comprehensive outlook on the possible stock price movement in the coming days. By examining these key indicators, we aim to offer valuable insights and predictions for potential investors.
Trend Analysis:
- Moving Averages (MA): The 5-day Moving Average (MA) has been consistently above the closing prices, indicating an upward trend in the short term.
- MACD: The MACD line has been consistently above the signal line, with both lines showing an upward trajectory, suggesting bullish momentum.
- Relative Strength Index (RSI): The RSI values have been relatively high, indicating overbought conditions in the market.
Momentum Analysis:
- Stochastic Oscillator: Both %K and %D values have been decreasing, moving towards the oversold territory, suggesting a potential reversal in momentum.
- Williams %R (WillR): The Williams %R indicator has been consistently in the oversold region, indicating a possible buying opportunity.
Volatility Analysis:
- Bollinger Bands (BB): The stock price has been trading within the upper and lower Bollinger Bands, suggesting a sideways movement with a slight downward bias.
- Bollinger Band Width (BBW): The BBW values have been decreasing, indicating a reduction in volatility in the market.
Volume Analysis:
- On-Balance Volume (OBV): The OBV values have shown fluctuations but have not confirmed a clear trend, indicating indecisiveness among market participants.
- Chaikin Money Flow (CMF): The CMF values have been fluctuating around the zero line, suggesting neutral money flow in the market.
Conclusion:
Based on the analysis of the technical indicators, the next few days' possible stock price movement for RERE is likely to experience consolidation with a slight downward bias. The momentum indicators are signaling a potential reversal in momentum, supported by the overbought conditions highlighted by the RSI. The volatility indicators suggest a decrease in volatility, further supporting a period of consolidation.
Investors should exercise caution and consider waiting for clearer signals before making significant trading decisions. It is advisable to monitor the price action closely and wait for confirmation of a new trend direction before entering or exiting positions.