Technical Analysis of RCL 2024-05-10
Overview:
In analyzing the technical indicators for RCL over the last 5 days, we will delve into the trend, momentum, volatility, and volume indicators to provide a comprehensive outlook on the possible stock price movement in the coming days.
Trend Analysis:
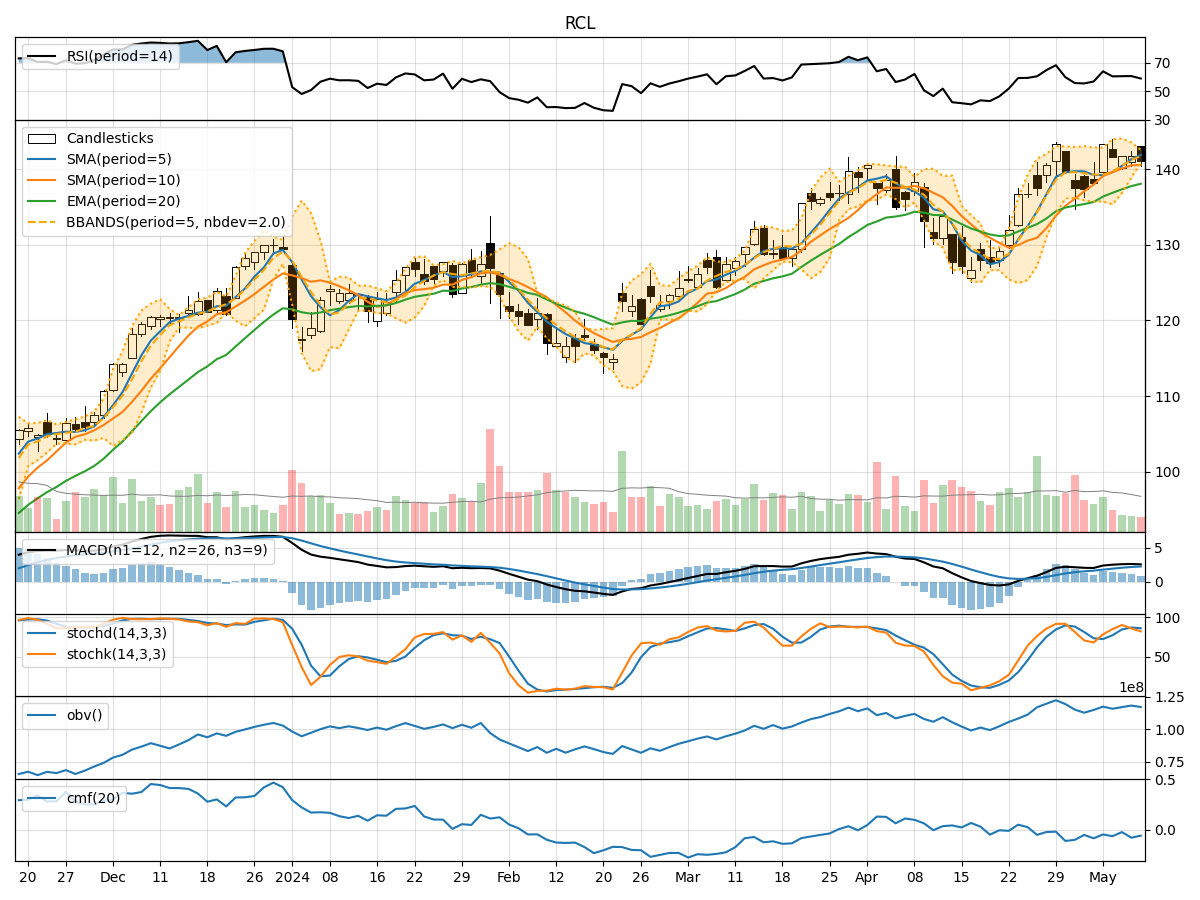
- Moving Averages (MA): The 5-day Moving Average (MA) has been consistently above the Simple Moving Average (SMA) and Exponential Moving Average (EMA), indicating a bullish trend.
- MACD: The MACD line has been above the signal line, with both lines showing an upward trend, suggesting bullish momentum.
Momentum Analysis:
- RSI: The Relative Strength Index (RSI) has been fluctuating around the 60-65 range, indicating a neutral momentum.
- Stochastic Oscillator: The Stochastic Oscillator has been in the overbought region, suggesting a potential reversal or consolidation.
Volatility Analysis:
- Bollinger Bands (BB): The Bollinger Bands have been narrowing, indicating decreasing volatility and a possible upcoming breakout.
Volume Analysis:
- On-Balance Volume (OBV): The OBV has been fluctuating, showing no clear trend in volume accumulation.
- Chaikin Money Flow (CMF): The CMF has been negative, indicating a lack of buying pressure.
Key Observations:
- The trend indicators suggest a bullish sentiment in the short term.
- Momentum indicators show a neutral stance with a potential for a reversal.
- Volatility is decreasing, hinting at a possible consolidation phase.
- Volume indicators do not provide a clear direction, signaling uncertainty in market participation.
Conclusion:
Based on the analysis of the technical indicators, the next few days for RCL stock price movement could be sideways with a slight bullish bias. Traders should watch for a potential breakout as volatility decreases, while also being cautious of a possible reversal indicated by the overbought Stochastic Oscillator. It is advisable to closely monitor price action and key support/resistance levels for better decision-making.