Technical Analysis of PSX 2024-05-10
Overview:
In analyzing the technical indicators for PSX over the last 5 days, we will delve into the trends, momentum, volatility, and volume indicators to provide a comprehensive outlook on the possible stock price movement in the coming days. By examining these key aspects, we aim to offer valuable insights and recommendations for potential investors.
Trend Analysis:
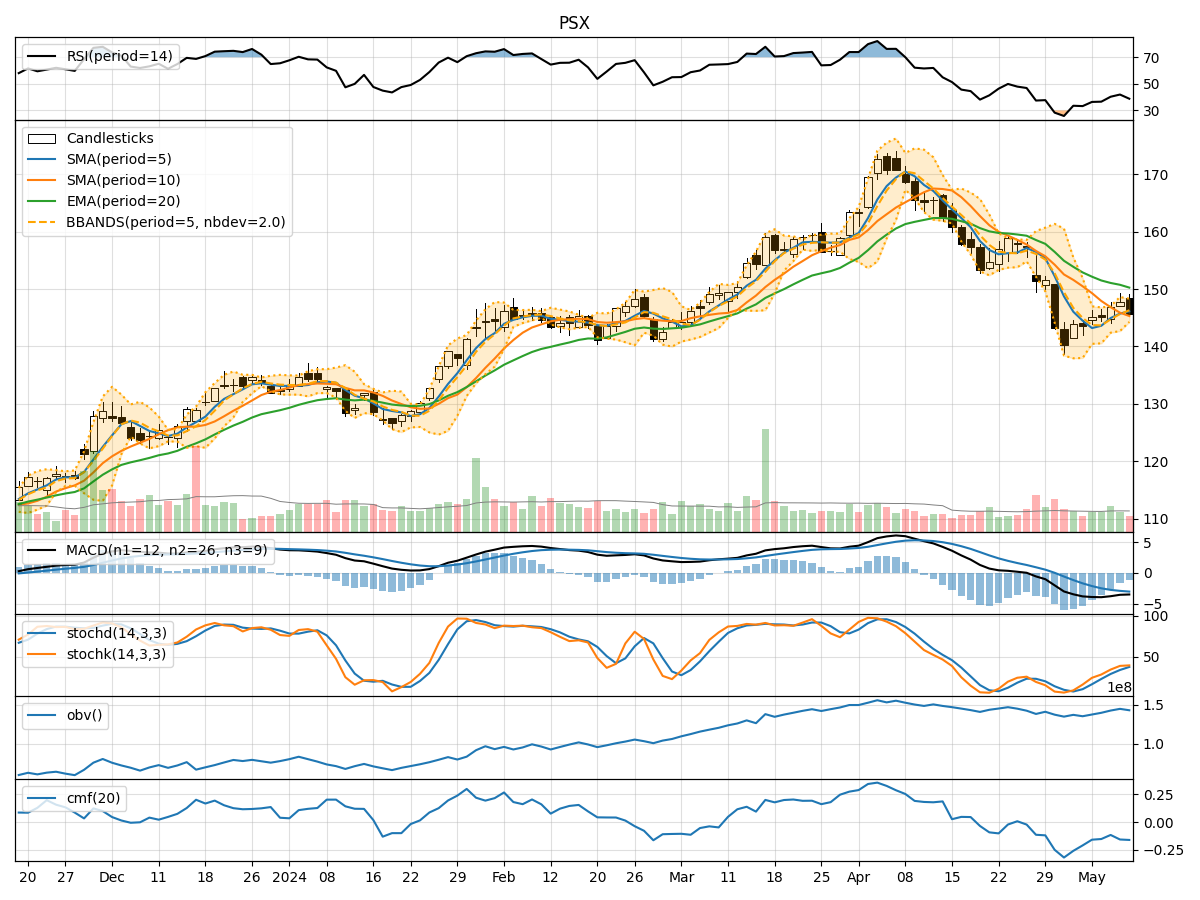
- Moving Averages (MA): The 5-day Moving Average (MA) has been fluctuating around the closing prices, indicating short-term price trends. The Simple Moving Average (SMA) and Exponential Moving Average (EMA) show a downward trend, suggesting a bearish sentiment in the market.
- MACD: The Moving Average Convergence Divergence (MACD) has been consistently negative, with the MACD line below the signal line. This indicates a bearish momentum in the stock price.
- Conclusion: The trend indicators point towards a bearish outlook for the stock in the near term.
Momentum Analysis:
- RSI: The Relative Strength Index (RSI) has been hovering around 40, indicating a neutral sentiment with a slight bearish bias.
- Stochastic Oscillator: Both %K and %D lines of the Stochastic Oscillator are in the oversold territory, suggesting a potential reversal in the stock price.
- Conclusion: The momentum indicators signal a neutral to slightly bearish momentum for the stock.
Volatility Analysis:
- Bollinger Bands (BB): The Bollinger Bands show a narrowing of the bands, indicating decreasing volatility in the stock price.
- Conclusion: The volatility indicators suggest a decreasing volatility environment for the stock.
Volume Analysis:
- On-Balance Volume (OBV): The OBV has been fluctuating, indicating a balance between buying and selling pressure in the stock.
- Chaikin Money Flow (CMF): The CMF is negative, suggesting a bearish money flow in the stock.
- Conclusion: The volume indicators reflect a neutral to bearish sentiment in terms of buying and selling pressure.
Overall Conclusion:
Based on the analysis of trend, momentum, volatility, and volume indicators, the overall outlook for PSX in the next few days is bearish. The trend indicators, supported by the momentum and volume indicators, suggest a continuation of the downward trend in the stock price. The decreasing volatility may indicate a period of consolidation or a potential breakout in the downward direction.
Recommendation:
Investors should exercise caution and consider waiting for a more definitive signal before making any trading decisions. It is advisable to closely monitor the price action and key support levels for potential entry or exit points. Additionally, keeping an eye on any significant news or market developments that could impact the stock price is crucial in making informed investment choices.
Disclaimer:
Remember that technical analysis is not foolproof and should be used in conjunction with other forms of analysis and risk management strategies. Market conditions can change rapidly, so it is essential to stay informed and adapt to new information accordingly.