Technical Analysis of PRM 2024-05-10
Overview:
In analyzing the technical indicators for PRM stock over the last 5 days, we will delve into the trends, momentum, volatility, and volume indicators to provide a comprehensive outlook on the possible stock price movement in the coming days. By examining key metrics such as moving averages, MACD, RSI, Bollinger Bands, and OBV, we aim to offer valuable insights and predictions for potential investors.
Trend Indicators:
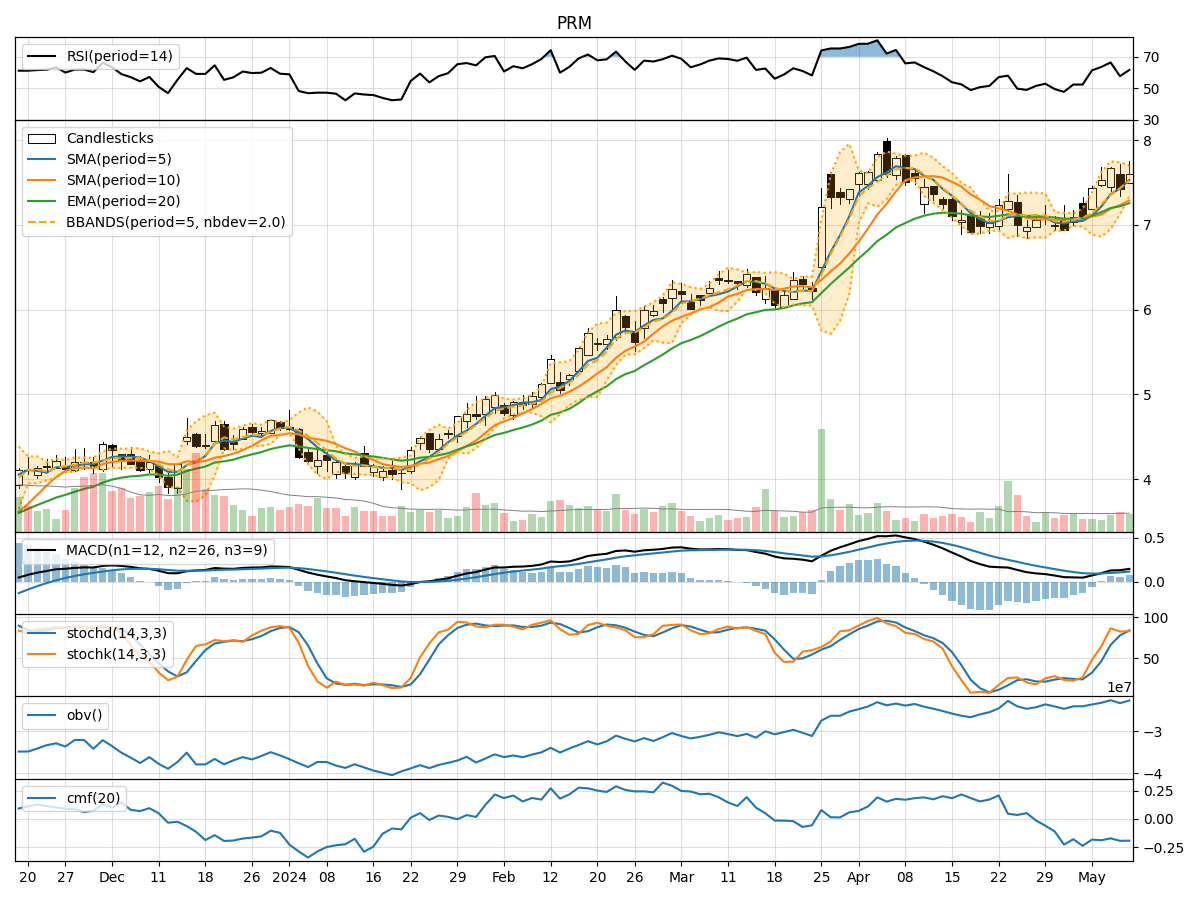
- Moving Averages (MA): The 5-day moving average has been consistently trending upwards, indicating a positive momentum in the stock price.
- MACD: The MACD line has been above the signal line for the past 5 days, suggesting a bullish trend.
- EMA: The exponential moving average has also been on an upward trajectory, supporting the bullish sentiment.
Momentum Indicators:
- RSI: The Relative Strength Index has shown fluctuations but generally remains in the neutral zone, indicating a balanced momentum.
- Stochastic Oscillator: Both %K and %D have been in the overbought territory, suggesting a potential reversal in the short term.
- Williams %R: The Williams %R is hovering around oversold levels, signaling a possible buying opportunity.
Volatility Indicators:
- Bollinger Bands: The stock price has been trading within the bands, with the upper band acting as a resistance level.
- Bollinger %B: The %B indicator is fluctuating, indicating potential volatility in the stock price.
- Bollinger Band Width: The band width has been narrowing, suggesting a potential breakout or consolidation phase.
Volume Indicators:
- On-Balance Volume (OBV): The OBV has shown mixed signals, reflecting indecision among investors.
- Chaikin Money Flow (CMF): The CMF remains negative, indicating selling pressure in the stock.
Key Observations and Opinions:
- Trend: The stock is in an upward trend supported by moving averages and MACD.
- Momentum: Momentum indicators suggest a mixed sentiment with potential for a short-term reversal.
- Volatility: Bollinger Bands indicate potential volatility ahead, possibly leading to a breakout.
- Volume: Volume indicators reflect indecisiveness among investors, with selling pressure evident in CMF.
Conclusion:
Based on the analysis of technical indicators, the next few days for PRM stock could see increased volatility with a potential for a bullish breakout. Investors should closely monitor the price action around the upper Bollinger Band and the stochastic oscillator for possible entry or exit points. While the trend remains bullish, caution is advised due to the mixed signals from momentum and volume indicators. Consider setting stop-loss levels to manage risk effectively.