Technical Analysis of PKG 2024-05-10
Overview:
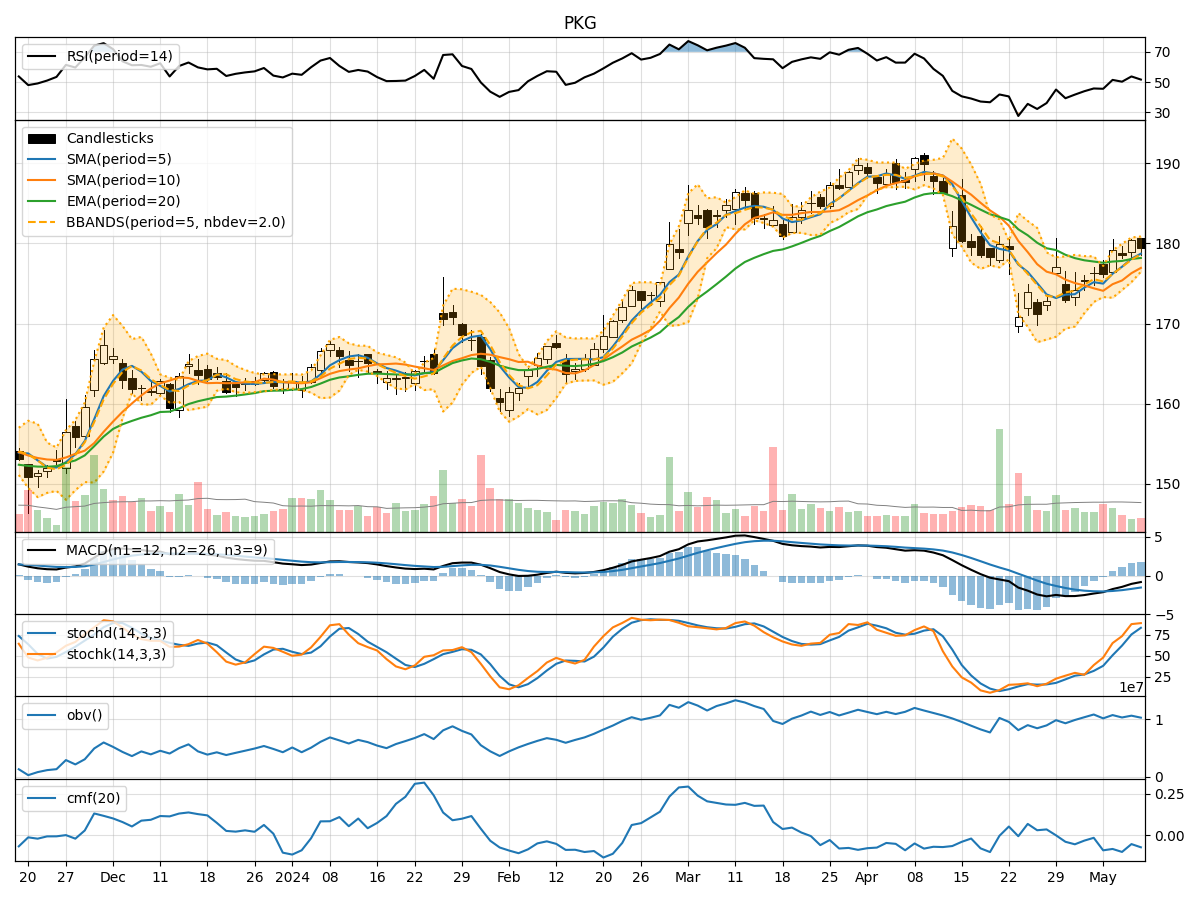
In analyzing the technical indicators for PKG over the last 5 days, we will delve into the trend, momentum, volatility, and volume indicators to provide a comprehensive outlook on the possible stock price movement in the coming days.
Trend Analysis:
- Moving Averages (MA): The 5-day Moving Average (MA) has been consistently above the Simple Moving Average (SMA) and Exponential Moving Average (EMA) over the past 5 days, indicating a bullish trend.
- MACD: The Moving Average Convergence Divergence (MACD) has shown positive values, with the MACD line consistently above the Signal line, suggesting bullish momentum.
Momentum Analysis:
- RSI: The Relative Strength Index (RSI) has been fluctuating around the 50 level, indicating a neutral momentum.
- Stochastic Oscillator: Both %K and %D values have been in the overbought territory, suggesting a potential reversal or consolidation.
Volatility Analysis:
- Bollinger Bands (BB): The stock price has been trading within the Bollinger Bands, with the bands narrowing, indicating decreasing volatility.
- Bollinger %B: The %B indicator has been hovering around 0.5, suggesting a neutral stance in terms of volatility.
Volume Analysis:
- On-Balance Volume (OBV): The OBV has shown a slight decrease over the past 5 days, indicating some distribution.
- Chaikin Money Flow (CMF): The CMF has been negative, suggesting selling pressure in the stock.
Key Observations and Opinions:
- Trend: The trend indicators point towards a bullish sentiment in the stock.
- Momentum: The momentum indicators suggest a neutral to slightly overbought condition, signaling a potential consolidation or reversal.
- Volatility: Volatility has been decreasing, indicating a possible period of consolidation.
- Volume: The volume indicators show a slight decrease in buying pressure.
Conclusion:
Based on the analysis of the technical indicators, the next few days for PKG stock price movement could be sideways with a slight bearish bias. The bullish trend may face resistance due to the overbought momentum and decreasing buying pressure indicated by the volume indicators. Traders should watch for potential consolidation or a minor pullback in the stock price.