Technical Analysis of PHI 2024-05-10
Overview:
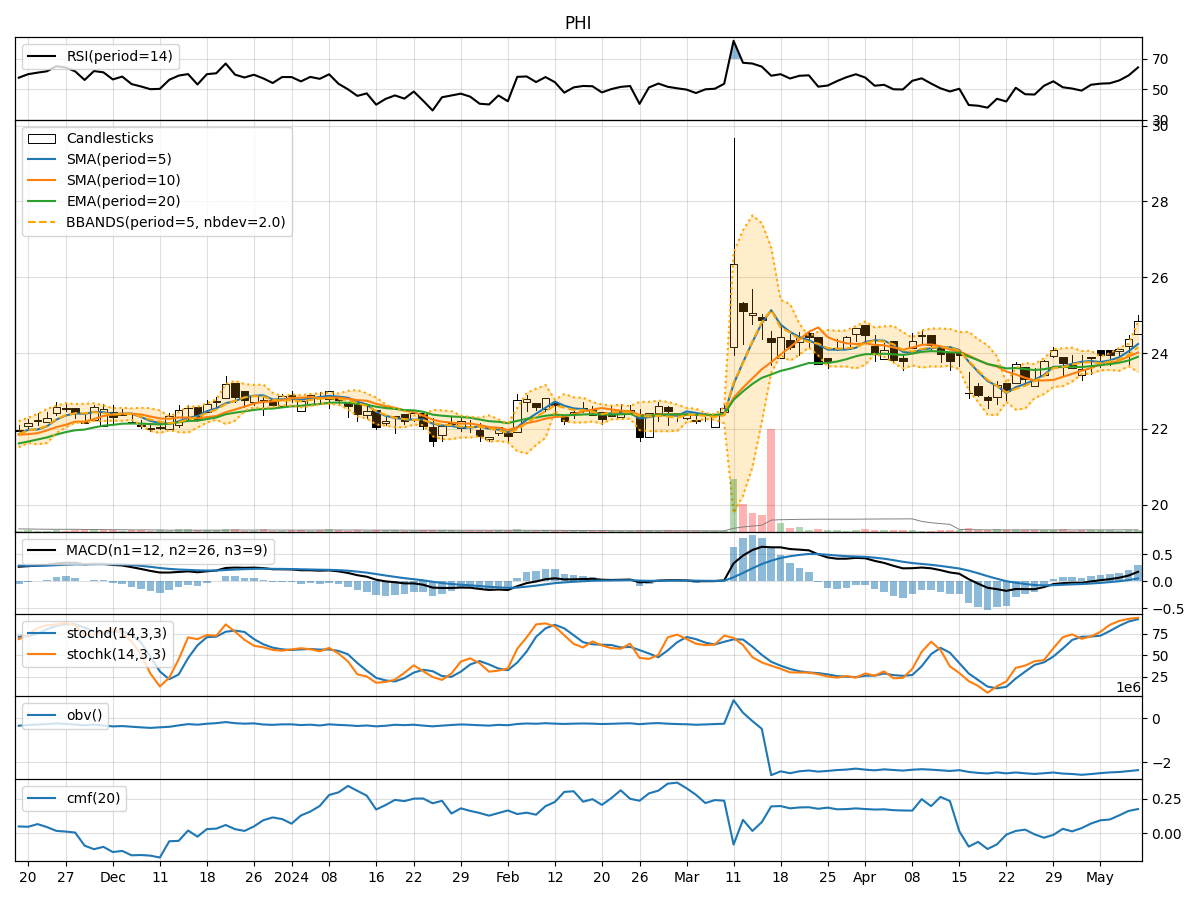
In analyzing the technical indicators for PHI stock over the last 5 days, we will delve into the trend, momentum, volatility, and volume indicators to provide a comprehensive outlook on the possible stock price movement in the upcoming days. By examining these key indicators, we aim to offer valuable insights and predictions for potential investors.
Trend Indicators:
- Moving Averages (MA): The 5-day Moving Average (MA) has been consistently rising, indicating an upward trend in the stock price.
- MACD (Moving Average Convergence Divergence): The MACD line has been increasing, showing bullish momentum in the stock.
- MACD Histogram: The MACD Histogram has also been on the rise, further supporting the bullish sentiment.
Key Observation: The trend indicators suggest a strong bullish momentum in the stock price.
Momentum Indicators:
- RSI (Relative Strength Index): The RSI has been increasing and is currently in the overbought territory, indicating a strong buying momentum.
- Stochastic Oscillator: Both %K and %D lines of the Stochastic Oscillator are in the overbought zone, signaling a potential reversal.
- Williams %R (Willams Percentage Range): The Williams %R is in the oversold region, suggesting a possible buying opportunity.
Key Observation: The momentum indicators show conflicting signals, with RSI indicating overbought conditions while Williams %R suggests oversold levels.
Volatility Indicators:
- Bollinger Bands: The Bollinger Bands have widened, indicating increased volatility in the stock price.
- Bollinger %B: The %B indicator is below 1, suggesting the stock is trading below the lower Bollinger Band, potentially indicating an oversold condition.
Key Observation: The volatility indicators point towards heightened price fluctuations and a possible oversold scenario.
Volume Indicators:
- On-Balance Volume (OBV): The OBV has been declining, indicating a potential distribution phase.
- Chaikin Money Flow (CMF): The CMF is positive, suggesting buying pressure in the stock.
Key Observation: The volume indicators show a divergence, with OBV signaling distribution while CMF indicates accumulation.
Conclusion:
Based on the analysis of the technical indicators, the stock of PHI is currently exhibiting a bullish trend with strong momentum. However, the conflicting signals from the momentum indicators and the oversold conditions highlighted by the volatility indicators suggest a possible short-term correction or consolidation in the stock price.
Investors should closely monitor the price action in the coming days for potential buying opportunities during dips or corrections. It is advisable to exercise caution and consider implementing risk management strategies to navigate the market uncertainties effectively.