Technical Analysis of PH 2024-05-10
Overview:
In analyzing the technical indicators for PH stock over the last 5 days, we will delve into the trends, momentum, volatility, and volume indicators to provide insights into the possible future stock price movements. By examining these indicators, we aim to offer a comprehensive analysis and make informed predictions for the upcoming trading days.
Trend Analysis:
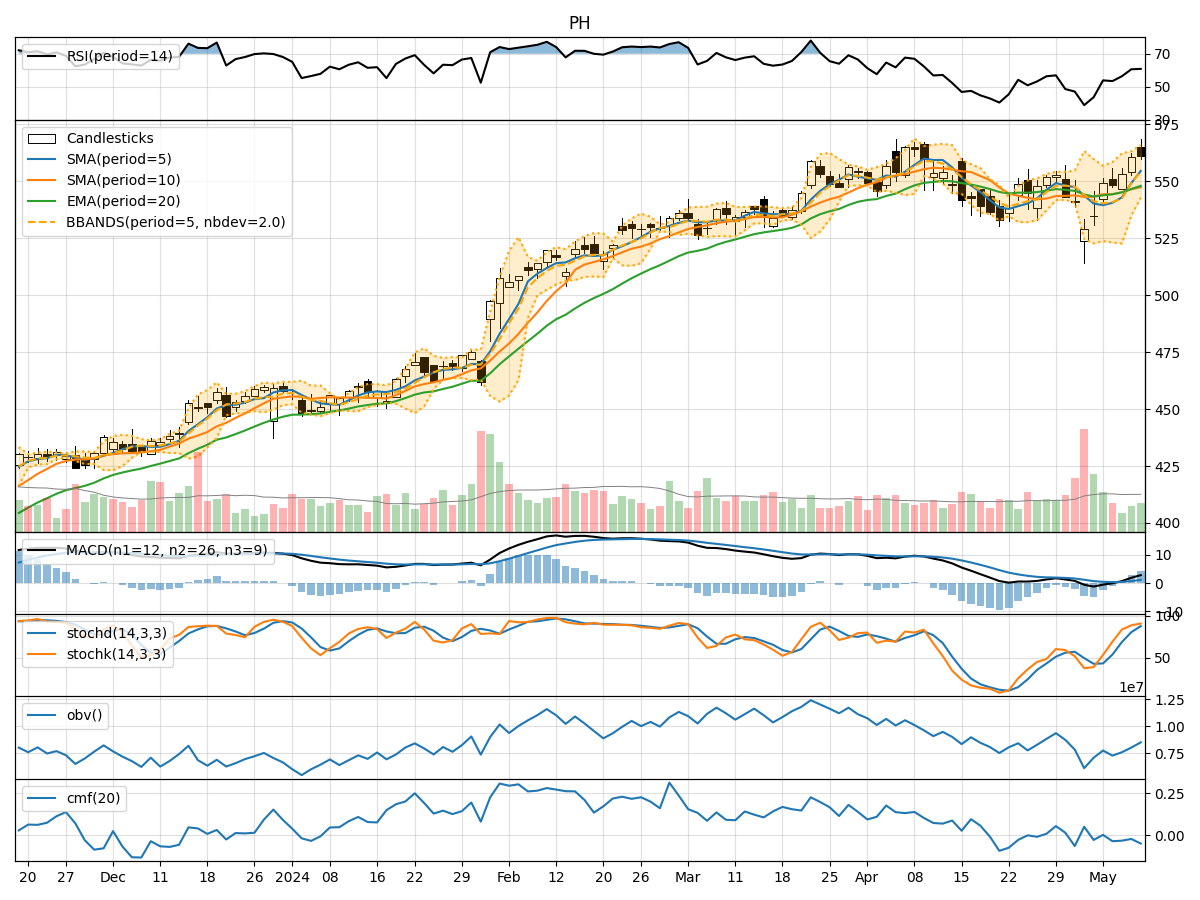
- Moving Averages (MA): The 5-day Moving Average (MA) has been consistently increasing, indicating a bullish trend in the short term.
- MACD: The Moving Average Convergence Divergence (MACD) has been positive and rising, suggesting bullish momentum.
- EMA: The Exponential Moving Average (EMA) has also been on an upward trajectory, supporting the bullish trend.
Momentum Analysis:
- RSI: The Relative Strength Index (RSI) has been increasing, showing strengthening momentum.
- Stochastic Oscillator: Both %K and %D have been in the overbought zone, indicating a strong bullish momentum.
- Williams %R: The Williams %R is in the oversold territory, suggesting a potential reversal in the short term.
Volatility Analysis:
- Bollinger Bands (BB): The Bollinger Bands have been widening, indicating increased volatility in the stock price.
- BB %B: The %B indicator has been fluctuating within a range, reflecting the volatility in the stock.
Volume Analysis:
- On-Balance Volume (OBV): The OBV has been declining, suggesting selling pressure in the stock.
- Chaikin Money Flow (CMF): The CMF has been negative, indicating a bearish money flow trend.
Key Observations:
- The trend indicators suggest a strong bullish sentiment in the short term.
- Momentum indicators indicate a robust bullish momentum, but the Williams %R signals a potential short-term reversal.
- Volatility has been increasing, which may lead to larger price swings.
- The declining OBV and negative CMF point towards bearish volume trends.
Conclusion:
Based on the analysis of the technical indicators, the stock is likely to experience further upward movement in the next few days. The bullish trend supported by moving averages and MACD, coupled with strong momentum signals, indicates a positive outlook. However, traders should be cautious of the potential short-term reversal indicated by the Williams %R. The increasing volatility may lead to larger price fluctuations, but overall, the bias remains bullish.