Technical Analysis of PGRU 2024-05-10
Overview:
In analyzing the technical indicators for PGRU over the last 5 days, we will delve into the trend, momentum, volatility, and volume indicators to provide a comprehensive outlook on the possible stock price movement in the coming days. By examining these key indicators, we aim to offer valuable insights and predictions to guide your investment decisions.
Trend Analysis:
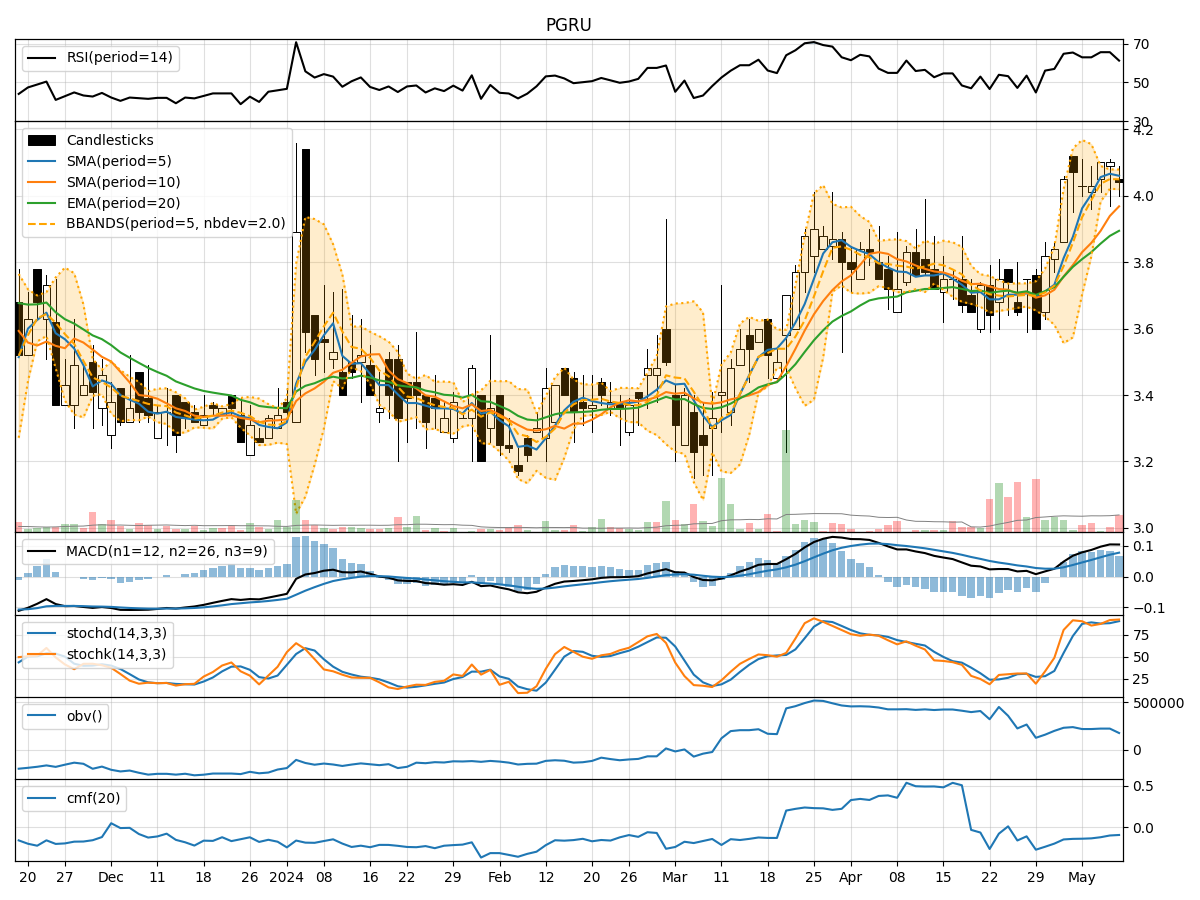
- Moving Averages (MA): The 5-day MA has been showing an upward trend, indicating a positive momentum in the stock price.
- MACD: The MACD line has been consistently above the signal line, suggesting a bullish trend in the stock.
- EMA: The EMA has been steadily increasing, further supporting the bullish sentiment in the stock.
Momentum Analysis:
- RSI: The RSI has been fluctuating around the 60-70 range, indicating a neutral momentum in the stock.
- Stochastic Oscillator: Both %K and %D have been in the overbought territory, signaling a potential reversal or consolidation phase.
- Williams %R: The Williams %R is hovering around the oversold region, suggesting a possible buying opportunity.
Volatility Analysis:
- Bollinger Bands (BB): The stock price has been trading within the bands, indicating a period of consolidation.
- BB Width: The width of the bands has been narrowing, suggesting a decrease in volatility.
- BB %B: The %B indicator is showing a neutral stance, neither overbought nor oversold.
Volume Analysis:
- On-Balance Volume (OBV): The OBV has been relatively flat, indicating a balance between buying and selling pressure.
- Chaikin Money Flow (CMF): The CMF has been negative, reflecting a lack of strong buying interest in the stock.
Key Observations:
- The trend indicators suggest a bullish sentiment in the stock, supported by the moving averages and MACD.
- Momentum indicators show a mixed signal, with RSI neutral, Stochastic overbought, and Williams %R oversold.
- Volatility indicators point towards a period of consolidation with decreasing volatility.
- Volume indicators indicate a lack of strong buying interest, as seen in the flat OBV and negative CMF.
Conclusion:
Based on the analysis of the technical indicators, the next few days' possible stock price movement for PGRU is likely to be sideways with a slight bullish bias. The stock may experience a period of consolidation as indicated by the narrowing Bollinger Bands and flat OBV. Traders should exercise caution and wait for clearer signals from the momentum indicators before making significant trading decisions.