Technical Analysis of PAM 2024-05-10
Overview:
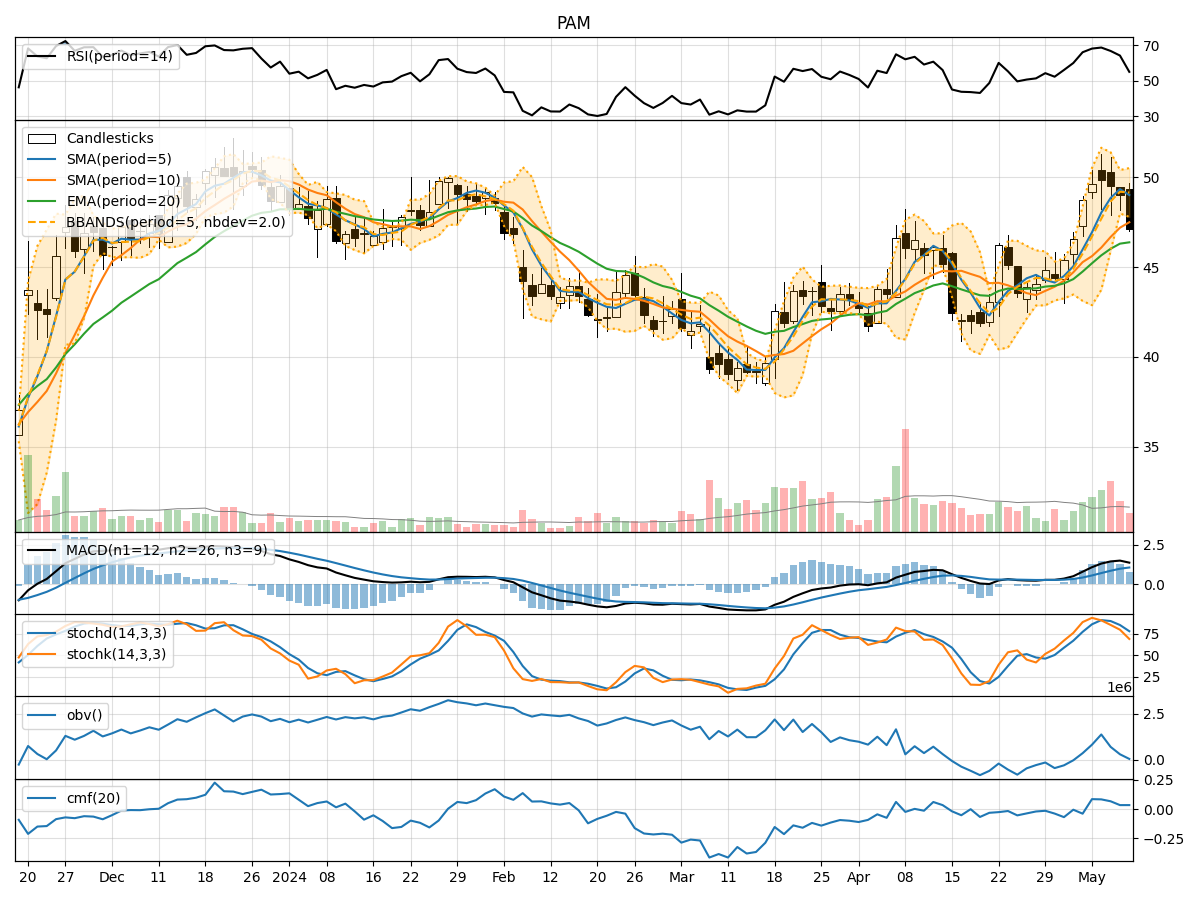
In the last 5 trading days, the stock price of PAM has shown some fluctuations. The moving averages have been trending upwards, indicating a positive momentum. However, the stock price has experienced some volatility as seen in the Bollinger Bands. The volume has been decreasing, suggesting a potential decrease in interest from investors. Let's analyze each category of technical indicators to determine the possible stock price movement in the next few days.
Trend Indicators:
- Moving Averages (MA): The 5-day MA has been consistently above the longer-term SMAs, indicating a bullish trend.
- MACD: The MACD line has been above the signal line, showing positive momentum.
- MACD Histogram: The histogram has been increasing, indicating strengthening bullish momentum.
Key Observation: The trend indicators suggest a bullish outlook for the stock.
Momentum Indicators:
- RSI: The RSI has been fluctuating but generally staying above 50, indicating a bullish momentum.
- Stochastic Oscillator: Both %K and %D have been decreasing but are still in the overbought territory.
- Williams %R: The indicator has been decreasing and is in the oversold region, suggesting a potential reversal.
Key Observation: Momentum indicators show mixed signals, with a slight bearish bias.
Volatility Indicators:
- Bollinger Bands: The stock price has been touching the lower Bollinger Band, indicating potential oversold conditions.
- Bollinger %B: The %B is close to 0, suggesting the stock is trading near the lower band.
Key Observation: Volatility indicators point towards a potential reversal or consolidation.
Volume Indicators:
- On-Balance Volume (OBV): The OBV has been decreasing, indicating selling pressure.
- Chaikin Money Flow (CMF): The CMF has been declining, suggesting outflow of money from the stock.
Key Observation: Volume indicators signal a decrease in buying interest.
Conclusion:
Based on the analysis of technical indicators, the next few days' possible stock price movement for PAM is likely to be sideways to slightly bearish. While the trend indicators suggest a bullish outlook, the momentum indicators show mixed signals with a bearish bias. The volatility indicators indicate a potential reversal or consolidation, and the volume indicators point towards a decrease in buying interest. Therefore, it is advisable to exercise caution and closely monitor the stock for any potential trend reversal or consolidation.