Technical Analysis of PAAS 2024-05-10
Overview:
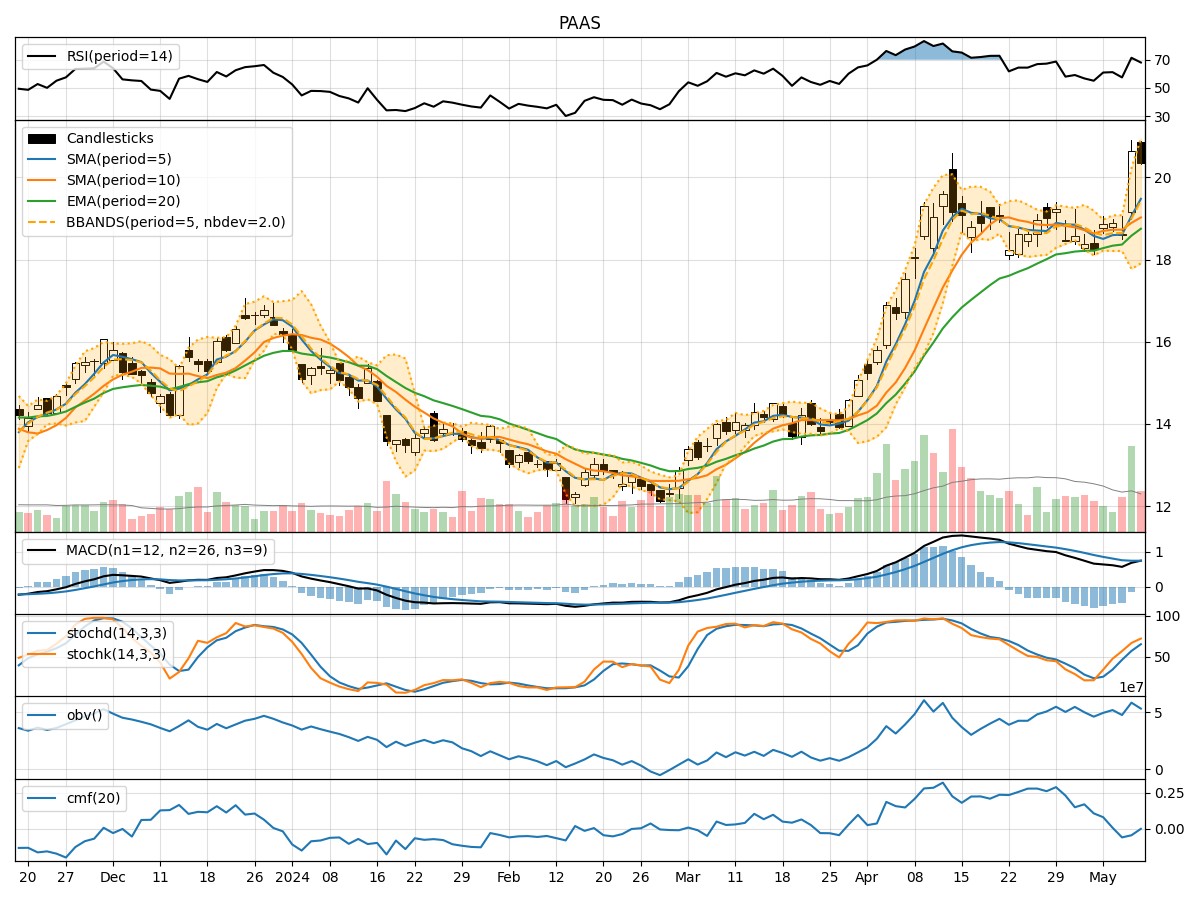
In analyzing the technical indicators for Pan American Silver Corp (PAAS) over the last 5 days, we will delve into the trend, momentum, volatility, and volume indicators to provide a comprehensive outlook on the possible stock price movement in the coming days.
Trend Indicators:
- Moving Averages (MA): The 5-day Moving Average (MA) has been trending above the Simple Moving Average (SMA) and Exponential Moving Average (EMA), indicating a short-term bullish trend.
- MACD: The MACD line has been consistently above the signal line, suggesting bullish momentum.
- MACD Histogram: The MACD Histogram has been mostly positive, indicating increasing bullish momentum.
Momentum Indicators:
- RSI: The Relative Strength Index (RSI) has been fluctuating in the neutral to overbought territory, suggesting a balanced momentum.
- Stochastic Oscillator: Both %K and %D have been in the overbought zone, indicating a potential reversal or consolidation.
- Williams %R: The Williams %R is in the oversold territory, signaling a possible buying opportunity.
Volatility Indicators:
- Bollinger Bands: The stock price has mostly stayed within the Bollinger Bands, with occasional breaches, indicating moderate volatility.
- Bollinger %B: The %B indicator has been fluctuating around the midline, suggesting a balanced volatility level.
Volume Indicators:
- On-Balance Volume (OBV): The OBV has shown mixed signals, reflecting indecision among market participants.
- Chaikin Money Flow (CMF): The CMF has been mostly neutral, indicating a lack of strong buying or selling pressure.
Key Observations:
- The trend indicators suggest a short-term bullish bias, supported by the moving averages and MACD.
- Momentum indicators show a mixed picture, with RSI indicating potential overbought conditions and Stochastic Oscillator signaling a reversal.
- Volatility remains moderate, with the Bollinger Bands containing price movements within a defined range.
- Volume indicators reflect indecision in the market, with OBV and CMF showing neutral signals.
Conclusion:
Based on the analysis of the technical indicators, the stock price of PAAS is likely to experience some consolidation or a minor pullback in the coming days. The bullish trend may pause temporarily as momentum indicators suggest a potential reversal, and volume indicators show a lack of strong buying or selling pressure. Traders should exercise caution and consider waiting for clearer signals before making significant trading decisions.