Technical Analysis of OTIS 2024-05-10
Overview:
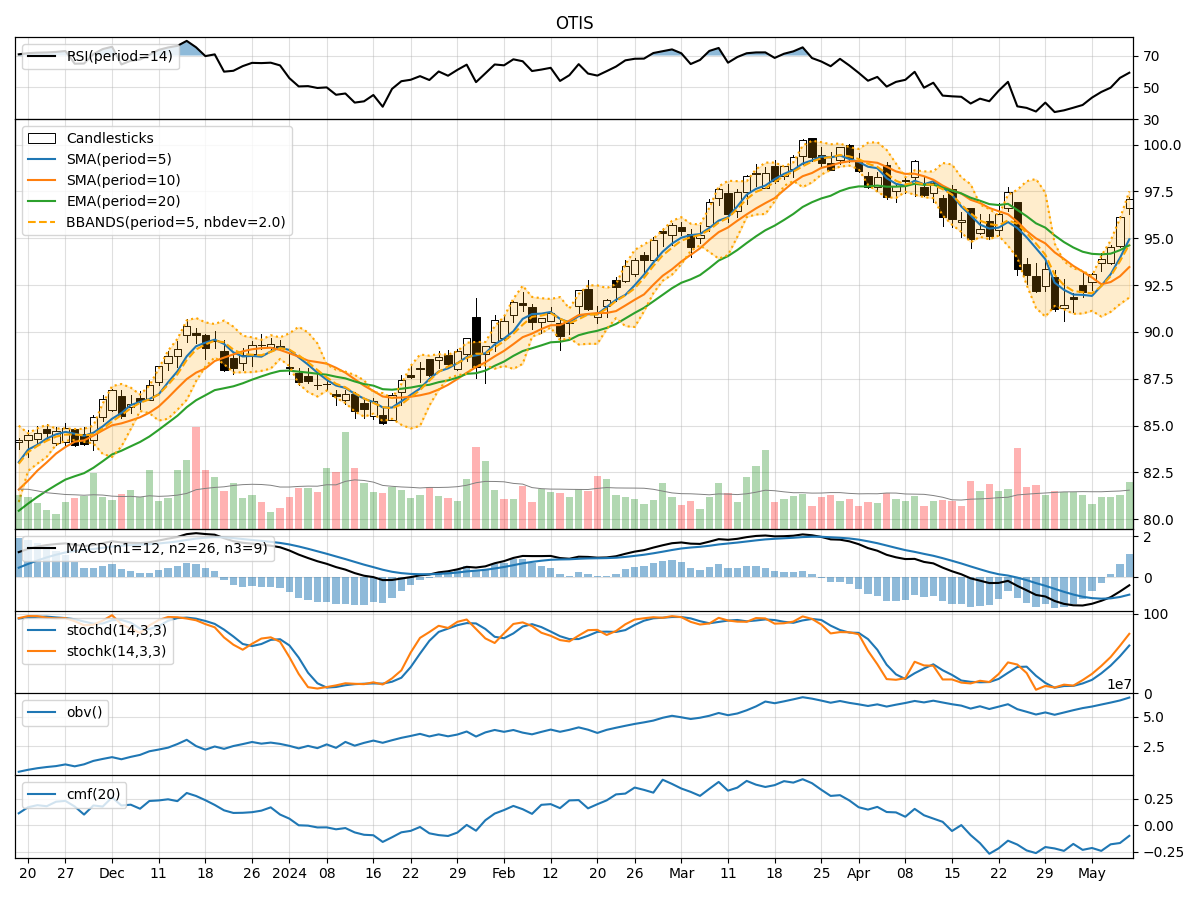
In analyzing the technical indicators for OTIS over the last 5 days, we will delve into the trend, momentum, volatility, and volume indicators to provide a comprehensive outlook on the possible stock price movement in the coming days.
Trend Indicators:
- Moving Averages (MA): The 5-day moving average has been consistently rising, indicating a bullish trend in the short term.
- MACD: The MACD line has been above the signal line, suggesting bullish momentum.
- EMA: The exponential moving average has also been trending upwards, supporting the bullish sentiment.
Momentum Indicators:
- RSI: The Relative Strength Index has been increasing, showing strengthening buying momentum.
- Stochastic Oscillator: Both %K and %D have been rising, indicating increasing buying pressure.
- Williams %R: The indicator has been moving towards the oversold territory, suggesting a potential reversal in the short term.
Volatility Indicators:
- Bollinger Bands: The bands have been widening, indicating increased volatility in the stock price.
- Bollinger %B: The %B indicator has been fluctuating within the bands, reflecting the volatility in the price movement.
Volume Indicators:
- On-Balance Volume (OBV): The OBV has been steadily increasing, signaling accumulation by investors.
- Chaikin Money Flow (CMF): The CMF has been negative but improving, indicating a potential shift towards buying pressure.
Key Observations and Opinions:
- Trend: The trend indicators suggest a strong bullish sentiment in the short term.
- Momentum: Momentum indicators support the bullish outlook with increasing buying pressure.
- Volatility: Volatility has been on the rise, which could lead to larger price swings.
- Volume: Accumulation is evident from the increasing OBV, potentially supporting further price appreciation.
Conclusion:
Based on the analysis of the technical indicators, the next few days for OTIS stock are likely to see continued upward movement. The bullish trend, supported by momentum and volume indicators, indicates a favorable outlook for the stock price. However, investors should remain cautious of the increased volatility and monitor key support and resistance levels for potential profit-taking opportunities. Overall, the technical analysis suggests a bullish bias for OTIS in the coming days.