Technical Analysis of ORAN 2024-05-10
Overview:
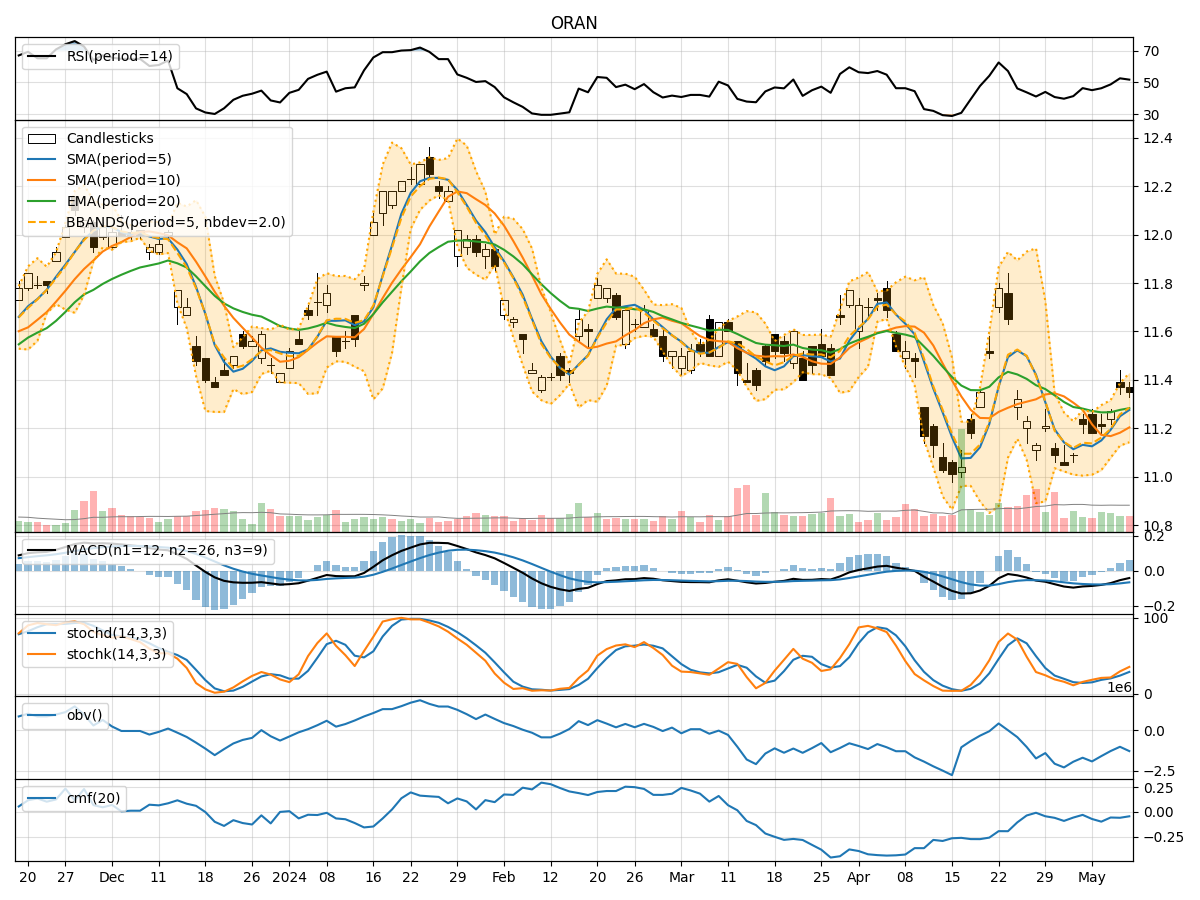
In analyzing the technical indicators for ORAN over the last 5 days, we will delve into the trend, momentum, volatility, and volume indicators to provide a comprehensive outlook on the possible stock price movement in the coming days.
Trend Analysis:
- Moving Averages (MA): The 5-day Moving Average (MA) has been fluctuating around the closing prices, indicating short-term price trends. The Simple Moving Average (SMA) and Exponential Moving Average (EMA) show a slight downward trend.
- MACD: The Moving Average Convergence Divergence (MACD) has been negative, with the MACD line below the signal line, suggesting a bearish momentum.
- Conclusion: The trend indicators point towards a bearish sentiment in the short term.
Momentum Analysis:
- RSI: The Relative Strength Index (RSI) has been increasing, indicating a strengthening momentum.
- Stochastic Oscillator: Both %K and %D have been rising, suggesting increasing buying pressure.
- Williams %R: The Williams %R is moving towards oversold levels, indicating a potential reversal.
- Conclusion: Momentum indicators suggest a bullish momentum building up.
Volatility Analysis:
- Bollinger Bands (BB): The Bollinger Bands have been widening, indicating increased price volatility.
- Conclusion: Volatility indicators show an increased volatility in the stock price.
Volume Analysis:
- On-Balance Volume (OBV): The OBV has been declining, indicating a decrease in buying volume.
- Chaikin Money Flow (CMF): The CMF has been negative, suggesting a lack of buying pressure.
- Conclusion: Volume indicators point towards a bearish sentiment in terms of volume.
Overall Conclusion:
Based on the analysis of trend, momentum, volatility, and volume indicators, the overall outlook for ORAN in the next few days is as follows: - Trend: Bearish - Momentum: Bullish - Volatility: Increased - Volume: Bearish
Final Recommendation:
Considering the mixed signals from different indicators, it is crucial to proceed with caution. While momentum indicators suggest a potential bullish move, the overall trend and volume indicators lean towards a bearish sentiment. The increased volatility adds another layer of uncertainty. Therefore, it is advisable to monitor the stock closely for further confirmation before making any trading decisions.