Technical Analysis of OMC 2024-05-10
Overview:
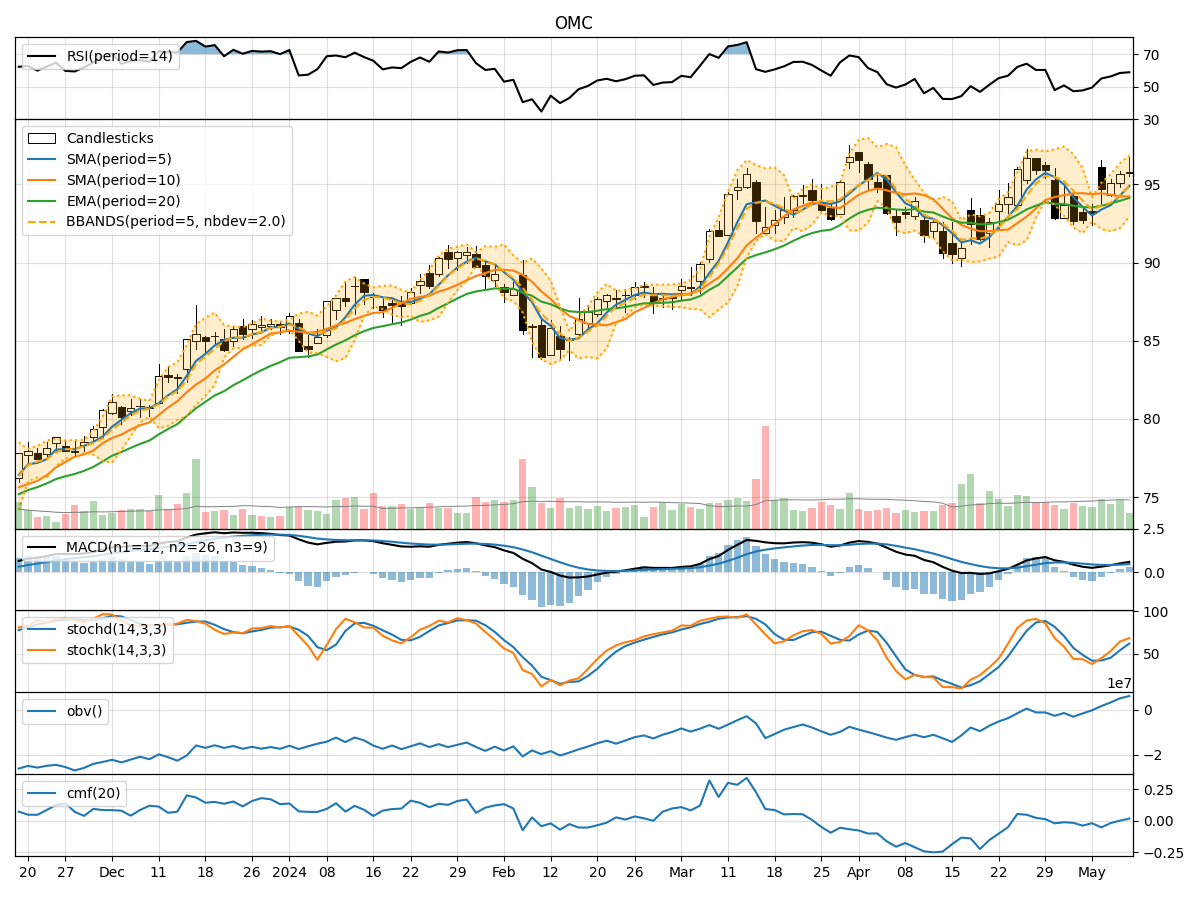
In analyzing the technical indicators for OMC over the last 5 days, we will delve into the trend, momentum, volatility, and volume indicators to provide a comprehensive outlook on the possible stock price movement in the coming days. By examining these key indicators, we aim to offer valuable insights and predictions for informed decision-making.
Trend Analysis:
- Moving Averages (MA): The 5-day Moving Average (MA) has been consistently below the Simple Moving Average (SMA) and Exponential Moving Average (EMA), indicating a downward trend.
- MACD: The MACD line has been positive, but the MACD Histogram has been decreasing, suggesting a potential reversal or weakening of the current uptrend.
Momentum Analysis:
- RSI: The Relative Strength Index (RSI) has been gradually increasing, indicating strengthening momentum.
- Stochastic Oscillator: Both %K and %D have been rising, signaling increasing buying pressure.
- Williams %R: The Williams %R has been moving towards oversold territory, suggesting a possible buying opportunity.
Volatility Analysis:
- Bollinger Bands (BB): The Bollinger Bands have been narrowing, indicating decreasing volatility.
- Bollinger Band %B: The %B indicator has been declining, suggesting a potential consolidation phase.
Volume Analysis:
- On-Balance Volume (OBV): The OBV has been steadily increasing, reflecting positive volume flow.
- Chaikin Money Flow (CMF): The CMF has been negative, indicating selling pressure in the market.
Key Observations:
- The trend indicators show a potential reversal in the current uptrend.
- Momentum indicators suggest a mixed sentiment with strengthening momentum but nearing overbought levels.
- Volatility indicators point towards decreasing volatility and a possible consolidation phase.
- Volume indicators reflect positive volume flow but with some selling pressure.
Conclusion:
Based on the analysis of the technical indicators, the next few days' possible stock price movement for OMC is likely to experience a consolidation phase with a slight downward bias. Traders should exercise caution and consider waiting for clearer signals before making significant trading decisions. The stock may enter a period of sideways movement before establishing a new trend direction. It is advisable to monitor key support and resistance levels closely for potential entry or exit points.
Disclaimer:
This analysis is based solely on technical indicators and historical data, and actual market movements may vary. It is essential to consider other factors and conduct thorough research before making any investment decisions. Consulting with a financial advisor is recommended to align strategies with individual investment goals and risk tolerance levels.