Technical Analysis of ODV 2024-05-10
Overview:
In analyzing the technical indicators for the stock based on the last 5 days of data, we will delve into the trend, momentum, volatility, and volume indicators to provide a comprehensive outlook on the possible stock price movement in the coming days.
Trend Analysis:
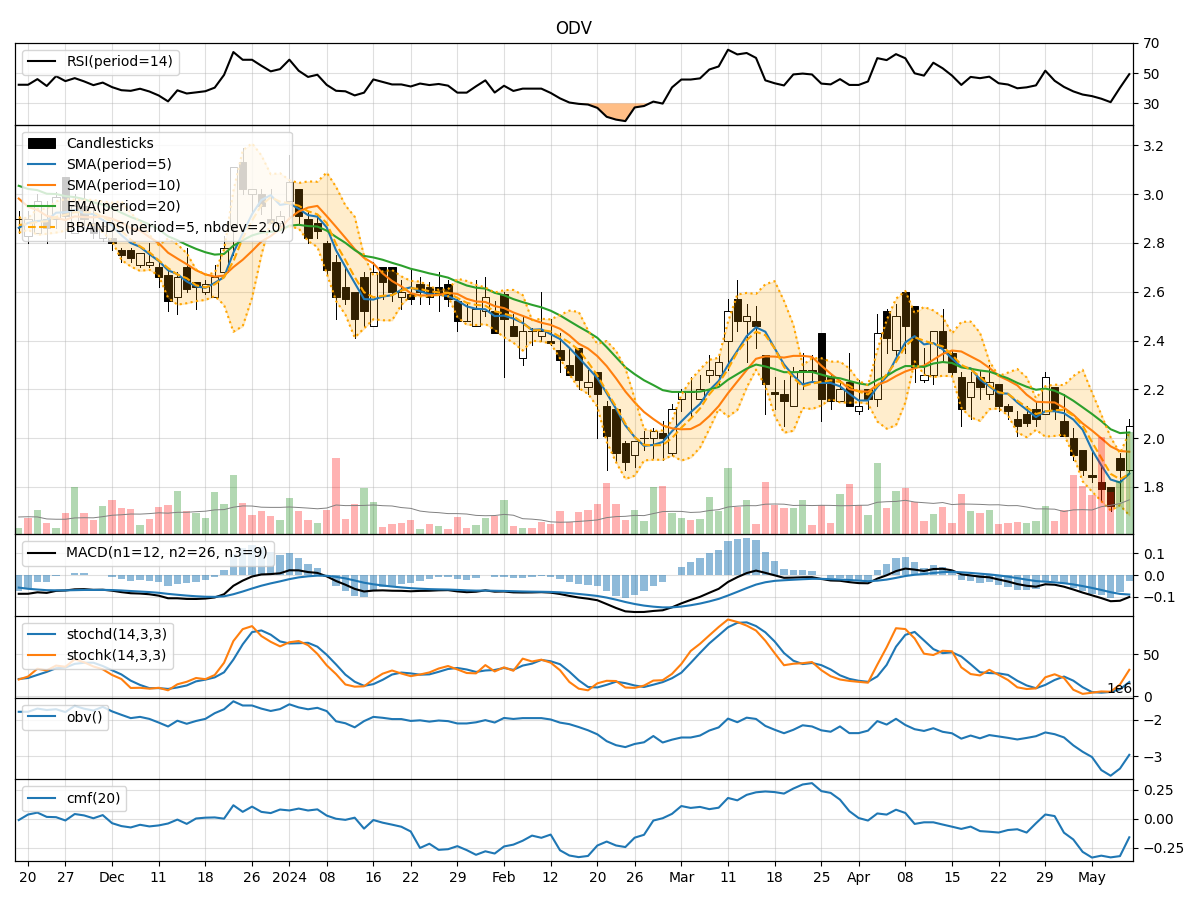
- Moving Averages (MA): The 5-day Moving Average (MA) has been consistently below the Simple Moving Average (SMA) and Exponential Moving Average (EMA) over the past 5 days, indicating a downtrend in the stock price.
- MACD: The Moving Average Convergence Divergence (MACD) has been negative, with the MACD line below the signal line, suggesting bearish momentum in the stock.
Momentum Analysis:
- RSI: The Relative Strength Index (RSI) has been relatively low, indicating oversold conditions in the stock.
- Stochastic Oscillator: Both %K and %D lines of the Stochastic Oscillator have been increasing, but still in the oversold territory, signaling a potential reversal in the stock price.
- Williams %R: The Williams %R indicator has been improving but remains in the oversold region, suggesting a possible bounce in the stock price.
Volatility Analysis:
- Bollinger Bands: The stock price has been trading below the lower Bollinger Band, indicating oversold conditions and a potential reversal in the price trend.
- Bollinger %B: The %B indicator is below 0.2, suggesting that the stock is oversold and may see a reversal in the near future.
Volume Analysis:
- On-Balance Volume (OBV): The OBV has been declining, indicating distribution and potential selling pressure in the stock.
- Chaikin Money Flow (CMF): The CMF has been negative, suggesting outflow of money from the stock.
Conclusion:
Based on the analysis of the technical indicators: - The stock is currently in an oversold condition based on the RSI, Stochastic, and Bollinger Bands. - The momentum indicators suggest a potential reversal in the stock price. - The volume indicators indicate selling pressure and outflow of money from the stock. - Considering the oversold conditions, potential reversal signals from momentum indicators, and negative volume indicators, the stock price is likely to see a short-term bounce or consolidation before any significant upward movement.
Recommendation:
- Short-term traders: Consider buying the stock for a potential bounce or consolidation.
- Long-term investors: Monitor the stock closely for signs of a reversal in the trend before considering entry positions.
Disclaimer:
This analysis is based solely on technical indicators and does not take into account fundamental factors that may influence stock prices. It is essential to conduct thorough research and consider all aspects before making any investment decisions.