Technical Analysis of OBK 2024-05-31
Overview:
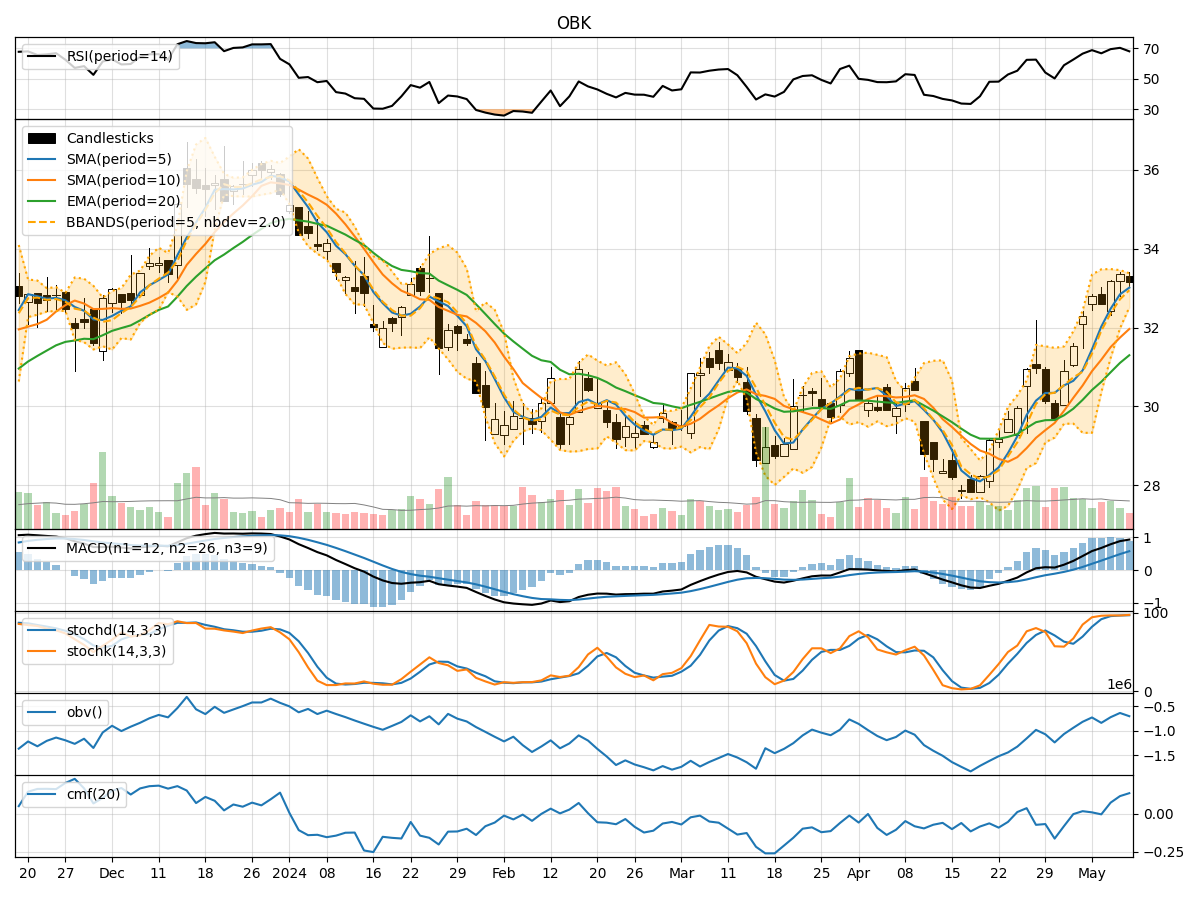
In the last 5 trading days, OBK stock has shown a downward trend in its closing price, accompanied by fluctuating trading volumes. The trend indicators suggest a weakening trend, with moving averages and MACD signaling a bearish sentiment. Momentum indicators also indicate a bearish momentum, while volatility indicators show a narrowing Bollinger Band width. Volume indicators reflect mixed signals, with OBV showing a slight decrease and CMF fluctuating around the zero line.
Trend Analysis:
- Moving Averages (MA): The 5-day MA has been consistently below the longer-term SMAs, indicating a short-term bearish trend.
- MACD: The MACD line has been below the signal line, confirming a bearish trend.
- EMA: The EMA has been declining, further supporting the bearish outlook.
Momentum Analysis:
- RSI: The RSI has been decreasing, indicating weakening buying pressure.
- Stochastic Oscillator: Both %K and %D have been trending downwards, suggesting a bearish momentum.
- Williams %R: The indicator has been in oversold territory, signaling a potential reversal but still indicating bearish sentiment.
Volatility Analysis:
- Bollinger Bands: The narrowing of the Bollinger Bands suggests decreasing volatility and a possible period of consolidation.
- Bollinger Band %B: The %B indicator has been fluctuating around the midline, indicating uncertainty in price direction.
Volume Analysis:
- On-Balance Volume (OBV): The OBV has shown a slight decrease, suggesting some distribution of the stock.
- Chaikin Money Flow (CMF): The CMF has been oscillating around the zero line, indicating a balance between buying and selling pressure.
Conclusion:
Based on the technical indicators analyzed: - Trend: The stock is in a downtrend as indicated by moving averages and MACD. - Momentum: Momentum indicators suggest a bearish momentum in the short term. - Volatility: The narrowing Bollinger Bands indicate a potential period of consolidation or a decrease in volatility. - Volume: Volume indicators show mixed signals, with a slight decrease in OBV and neutral CMF.
Forecast:
Considering the overall bearish trend and momentum, the next few days are likely to see the stock price continue its downward movement. Traders should exercise caution and consider shorting opportunities or wait for a clear reversal signal before considering long positions. The narrowing Bollinger Bands may lead to a period of consolidation before a potential breakout in either direction. Monitoring key support and resistance levels will be crucial in determining the stock's future price movement.