Technical Analysis of NVT 2024-05-10
Overview:
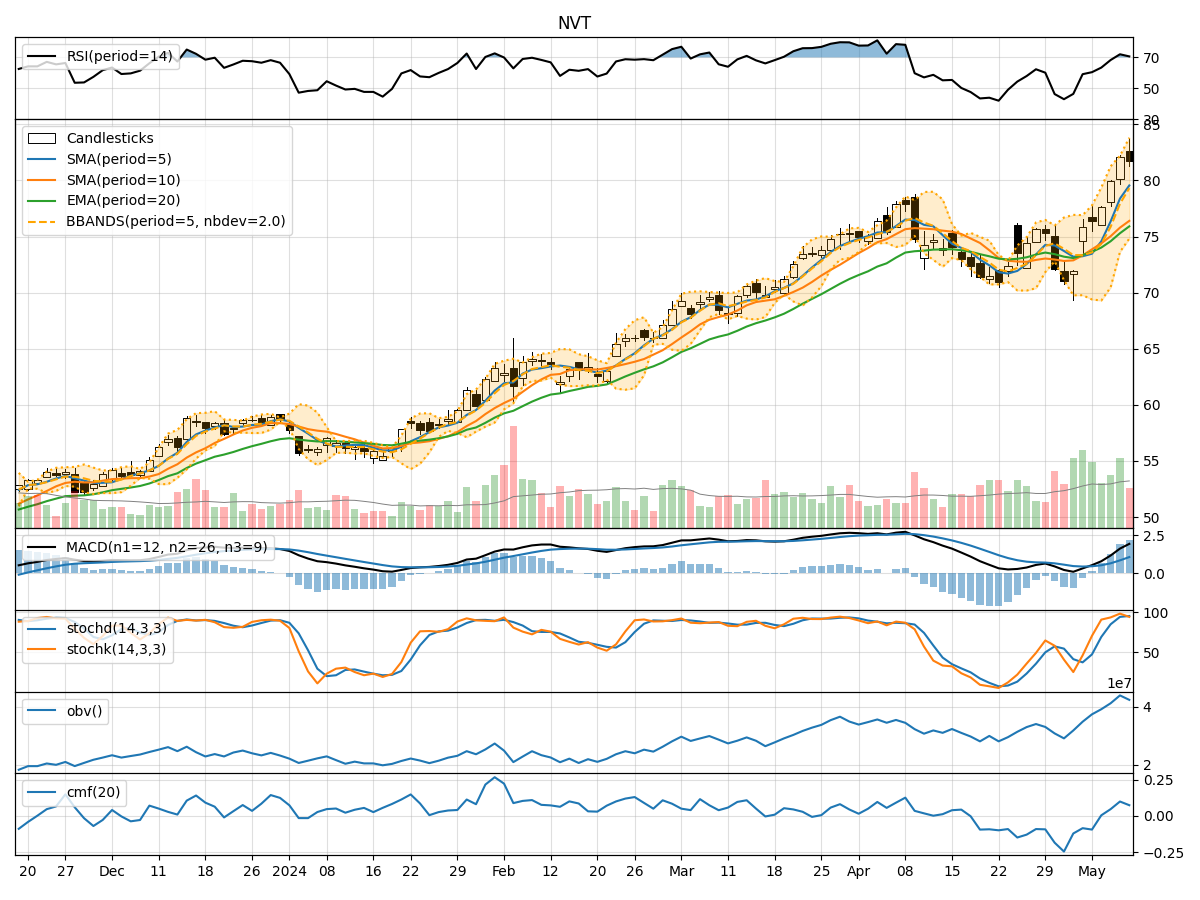
In analyzing the provided Technical Analysis (TA) data for the last 5 days, we will delve into the trend, momentum, volatility, and volume indicators to forecast the possible stock price movement for the next few days. By examining these key indicators, we aim to provide a comprehensive and insightful analysis to guide your investment decisions.
Trend Indicators:
- Moving Averages (MA): The moving averages have been consistently trending upwards over the last 5 days, indicating a bullish trend in the stock price.
- MACD (Moving Average Convergence Divergence): The MACD and its signal line have been positive and increasing, suggesting strong bullish momentum.
Momentum Indicators:
- RSI (Relative Strength Index): The RSI values have been in the overbought territory, indicating a strong bullish momentum.
- Stochastic Oscillator: Both %K and %D values have been in the overbought zone, signaling a potential reversal or consolidation.
Volatility Indicators:
- Bollinger Bands: The stock price has been consistently trading above the middle Bollinger Band, indicating an uptrend with increased volatility.
Volume Indicators:
- On-Balance Volume (OBV): The OBV has been steadily increasing, reflecting strong buying pressure in the stock.
- Chaikin Money Flow (CMF): The CMF has been positive, indicating that money is flowing into the stock.
Key Observations and Opinions:
- Trend: The stock is in a strong bullish trend based on moving averages and MACD.
- Momentum: The RSI and Stochastic Oscillator suggest overbought conditions, potentially signaling a reversal or consolidation.
- Volatility: The Bollinger Bands show increased volatility, which could lead to larger price swings.
- Volume: The OBV and CMF indicate strong buying pressure and positive money flow into the stock.
Conclusion:
Based on the analysis of the technical indicators, the stock is currently in an overbought state with strong bullish momentum. However, the overbought conditions in the momentum indicators suggest a potential reversal or consolidation in the near future. Considering the increased volatility and strong buying pressure, it is likely that the stock price may experience sideways movement or a slight correction in the next few days.
Recommendation:
- Short-term Traders: Consider taking profits or setting tight stop-loss orders to protect gains.
- Long-term Investors: Monitor the price action closely for potential entry points during a consolidation phase.
Always remember to stay updated with the latest market developments and adjust your strategy accordingly to mitigate risks and maximize returns.