Technical Analysis of NSC 2024-05-10
Overview:
In analyzing the technical indicators for NSC over the last 5 days, we will delve into the trend, momentum, volatility, and volume indicators to provide a comprehensive outlook on the possible stock price movement in the coming days. By examining these key aspects, we aim to offer valuable insights and predictions to guide investment decisions.
Trend Analysis:
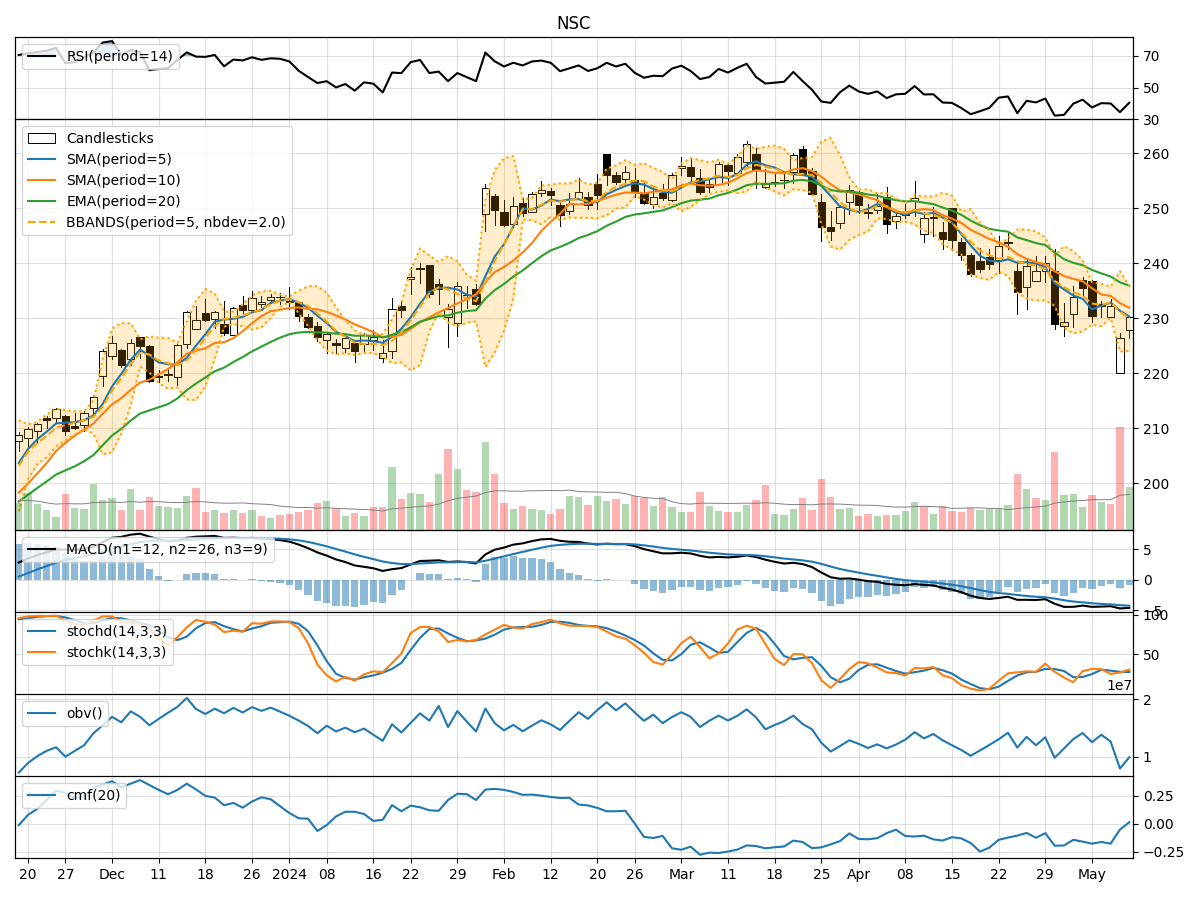
- Moving Averages (MA): The 5-day MA has been gradually decreasing, indicating a short-term bearish trend.
- MACD: The MACD line has been consistently below the signal line, suggesting a bearish momentum.
- EMA: The EMA has been declining, reinforcing the bearish sentiment in the short to medium term.
Momentum Analysis:
- RSI: The RSI has been fluctuating in the oversold region, indicating a bearish momentum.
- Stochastic Oscillator: Both %K and %D have been trending downwards, signaling a bearish sentiment.
- Williams %R: The indicator has been consistently in the oversold territory, reflecting a bearish momentum.
Volatility Analysis:
- Bollinger Bands (BB): The bands have been narrowing, suggesting decreasing volatility in the stock price.
- Bollinger %B: The %B indicator has been hovering around the midline, indicating a lack of strong trend direction.
Volume Analysis:
- On-Balance Volume (OBV): The OBV has been declining, indicating selling pressure in the stock.
- Chaikin Money Flow (CMF): The CMF has been negative, reflecting a bearish sentiment in the market.
Key Observations:
- The trend indicators, momentum oscillators, and volume indicators all point towards a bearish outlook for NSC in the short term.
- Volatility has been decreasing, suggesting a lack of significant price movements in the near future.
- The overall sentiment is bearish, with indicators aligning towards a downward trend continuation.
Conclusion:
Based on the analysis of the technical indicators, the next few days for NSC are likely to see further downward movement in the stock price. Investors should exercise caution and consider potential shorting opportunities or wait for a more favorable entry point. The bearish trend is expected to persist, and traders should closely monitor key support levels for potential reversals. It is advisable to avoid long positions until a clear reversal pattern emerges in the technical indicators.