Technical Analysis of NRDY 2024-05-31
Overview:
In analyzing the technical indicators for NRDY over the last 5 days, we will delve into the trend, momentum, volatility, and volume indicators to provide a comprehensive outlook on the possible stock price movement in the coming days. By examining these key aspects, we aim to offer valuable insights and recommendations for potential investors.
Trend Analysis:
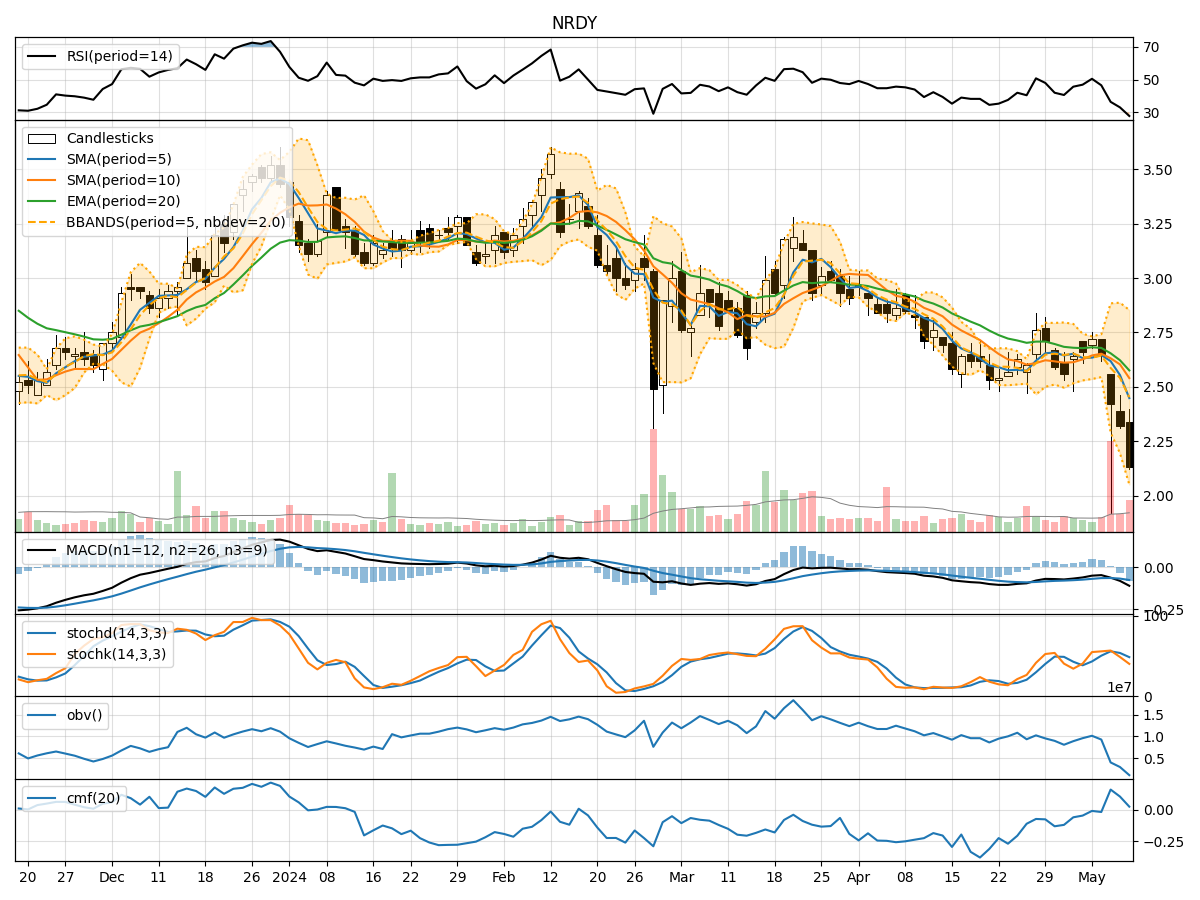
- Moving Averages (MA): The 5-day MA has been consistently decreasing, indicating a downward trend in the stock price.
- MACD: The MACD line has been negative and decreasing, suggesting bearish momentum in the stock.
- EMA: The EMA has also been declining, further supporting the bearish trend in the stock.
Momentum Analysis:
- RSI: The RSI has been decreasing, reflecting weakening momentum in the stock.
- Stochastic Oscillator: Both %K and %D have been trending downwards, indicating a bearish momentum.
- Williams %R: The indicator has been in oversold territory, signaling a potential reversal or continuation of the downtrend.
Volatility Analysis:
- Bollinger Bands (BB): The stock price has been consistently below the lower Bollinger Band, suggesting oversold conditions.
- BB Percentage (BBP): The BBP has been increasing, indicating a potential bounce back towards the middle band.
Volume Analysis:
- On-Balance Volume (OBV): The OBV has been decreasing, indicating selling pressure in the stock.
- Chaikin Money Flow (CMF): The CMF has been negative, suggesting outflow of money from the stock.
Key Observations:
- The stock is currently in a downtrend based on moving averages and MACD.
- Momentum indicators like RSI and Stochastic Oscillator are showing bearish signals.
- Volatility indicators suggest the stock is oversold and may see a reversal.
- Volume indicators reflect selling pressure and negative money flow.
Conclusion:
Based on the analysis of the technical indicators, the next few days for NRDY are likely to see further downside movement in the stock price. The overall trend, momentum, and volume indicators point towards a bearish outlook. However, the increasing BBP and potential bounce back towards the middle Bollinger Band could indicate a short-term reversal or consolidation before resuming the downtrend. Investors should exercise caution and consider waiting for more confirmation before making any trading decisions.