Technical Analysis of NOMD 2024-05-10
Overview:
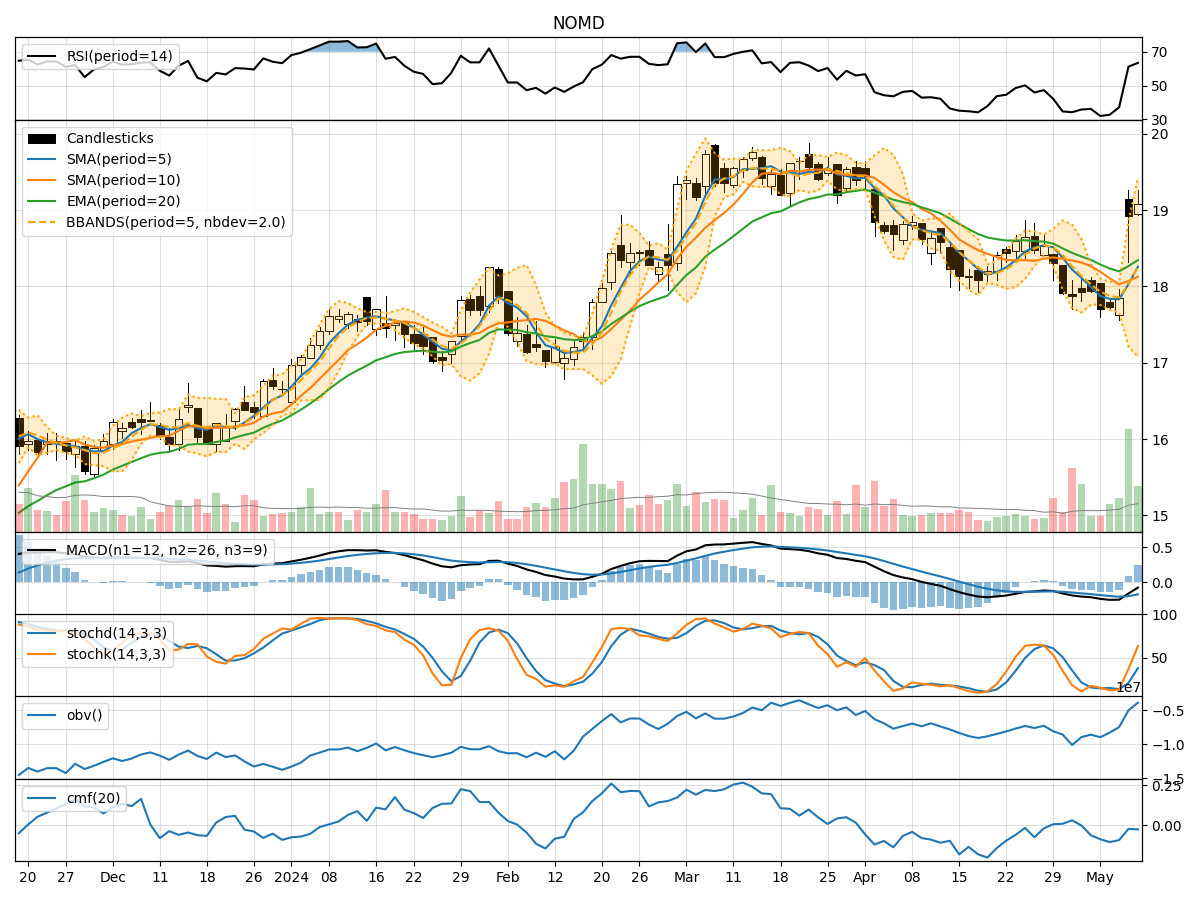
In analyzing the technical indicators for NOMD over the last 5 days, we will delve into the trend, momentum, volatility, and volume indicators to provide a comprehensive assessment of the stock's potential price movement. By examining these key factors, we aim to offer valuable insights and predictions for the next few days.
Trend Analysis:
- Moving Averages (MA): The 5-day MA has been fluctuating around the 18.00 level, indicating a short-term consolidation phase.
- MACD: The MACD line has been hovering around the zero line, suggesting a lack of strong trend direction.
- EMA: The EMA has been relatively flat, reflecting a neutral trend in the medium to long term.
Key Observation: The trend indicators point towards a sideways movement with no clear trend direction.
Momentum Analysis:
- RSI: The RSI has been oscillating between 30 and 70, currently indicating a neutral stance.
- Stochastic Oscillator: The stochastic indicators have shown mixed signals, with the %K line crossing the %D line multiple times.
- Williams %R: The Williams %R is currently near oversold levels but has not shown a strong reversal signal.
Key Observation: Momentum indicators suggest a lack of strong bullish or bearish momentum, indicating a potential continuation of the current sideways movement.
Volatility Analysis:
- Bollinger Bands (BB): The Bollinger Bands have widened, indicating increased volatility in the stock price.
- BB %B: The %B indicator is below 1, suggesting the stock is trading below the lower Bollinger Band.
- BB Width: The widening of the Bollinger Bands suggests a potential increase in price volatility.
Key Observation: Volatility indicators signal a potential increase in price fluctuations, which could lead to sharper price movements in the coming days.
Volume Analysis:
- On-Balance Volume (OBV): The OBV has shown a slight increase, indicating some accumulation in the stock.
- Chaikin Money Flow (CMF): The CMF has been negative, suggesting a slight outflow of money from the stock.
Key Observation: Volume indicators imply a mixed sentiment, with some accumulation but overall neutral money flow.
Conclusion:
Based on the analysis of the technical indicators, the next few days for NOMD could see sideways movement with increased volatility. The lack of a clear trend direction from the trend and momentum indicators, coupled with the potential for heightened volatility, suggests that the stock may continue to trade within a range.
Recommendation: It is advisable to closely monitor the price action and key support/resistance levels for potential trading opportunities. Consider implementing risk management strategies to navigate the increased volatility effectively.