Technical Analysis of NOA 2024-05-10
Overview:
In analyzing the technical indicators for NOA over the last 5 days, we will delve into the trend, momentum, volatility, and volume indicators to provide a comprehensive assessment of the stock's potential price movement. By examining these key factors, we aim to offer valuable insights and predictions for the next few days.
Trend Analysis:
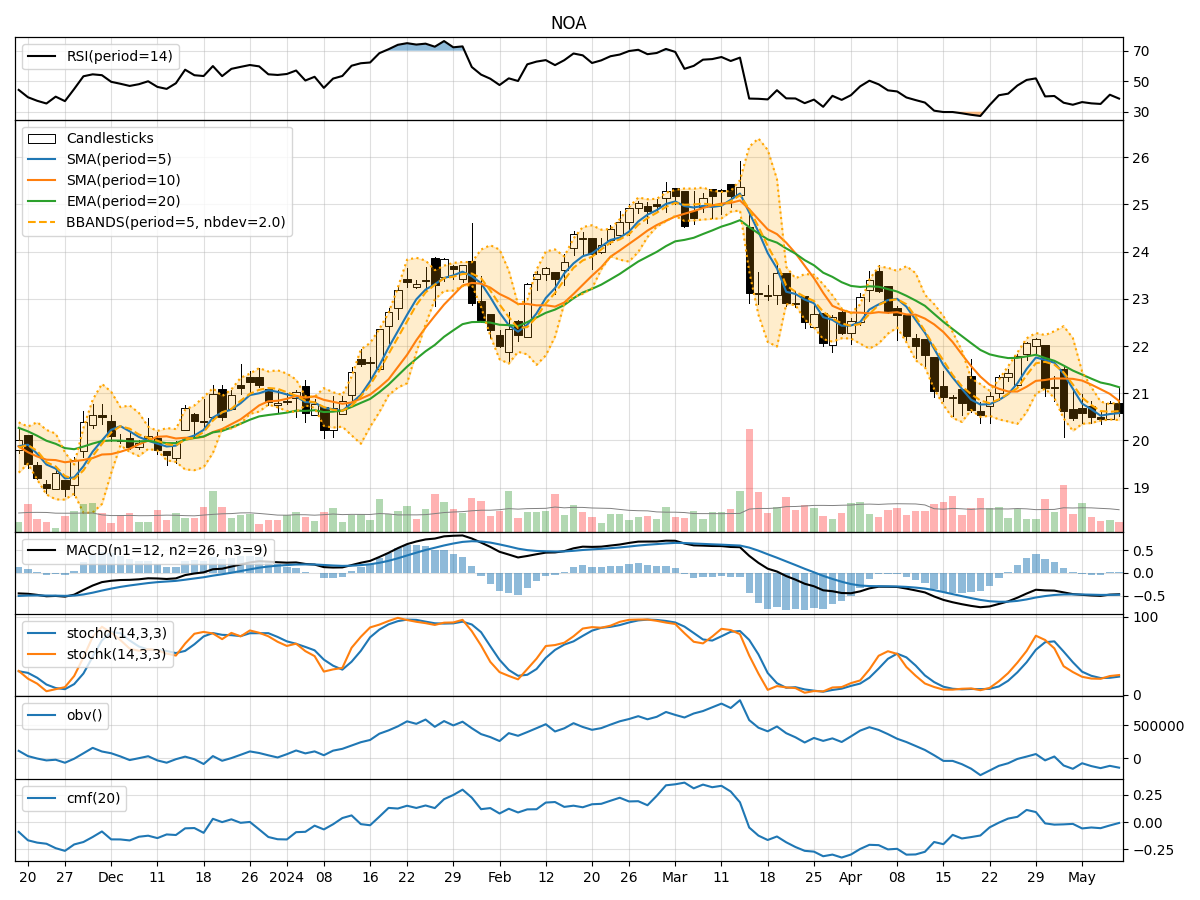
- Moving Averages (MA): The 5-day MA has been consistently below the closing price, indicating a short-term downtrend.
- MACD: The MACD line has been below the signal line, suggesting bearish momentum.
- EMA: The EMA has been declining, further supporting the bearish trend.
Key Observation: The trend indicators point towards a downward trajectory for NOA.
Momentum Analysis:
- RSI: The RSI has been relatively low, indicating bearish momentum.
- Stochastic Oscillator: Both %K and %D have been in oversold territory, signaling a potential reversal.
- Williams %R: The indicator has been in the oversold region, suggesting a possible bounce back.
Key Observation: Momentum indicators show a bearish sentiment, but with signs of a potential reversal.
Volatility Analysis:
- Bollinger Bands (BB): The stock price has been trading within the lower Bollinger Band, indicating potential oversold conditions.
- Bollinger %B: The %B value has been below 0.2, suggesting a possible bounce back.
Key Observation: Volatility indicators hint at a possible reversal or bounce back in the stock price.
Volume Analysis:
- On-Balance Volume (OBV): The OBV has been declining, indicating selling pressure.
- Chaikin Money Flow (CMF): The CMF has been negative, reflecting a lack of buying interest.
Key Observation: Volume indicators support the bearish sentiment in the stock.
Conclusion:
Based on the analysis of trend, momentum, volatility, and volume indicators, the overall outlook for NOA in the next few days leans towards a bearish sentiment. However, there are indications of a potential reversal in momentum and volatility, which could lead to a temporary bounce back in the stock price. Traders should exercise caution and closely monitor key levels for potential entry or exit points.
Key Conclusion:
The stock is likely to experience further downside in the short term, but with potential for a temporary rebound based on momentum and volatility signals. Investors should remain vigilant and consider risk management strategies in their trading decisions.