Technical Analysis of NMR 2024-05-10
Overview:
In analyzing the technical indicators for NMR over the last 5 days, we will delve into the trend, momentum, volatility, and volume indicators to provide a comprehensive outlook on the possible stock price movement in the coming days.
Trend Analysis:
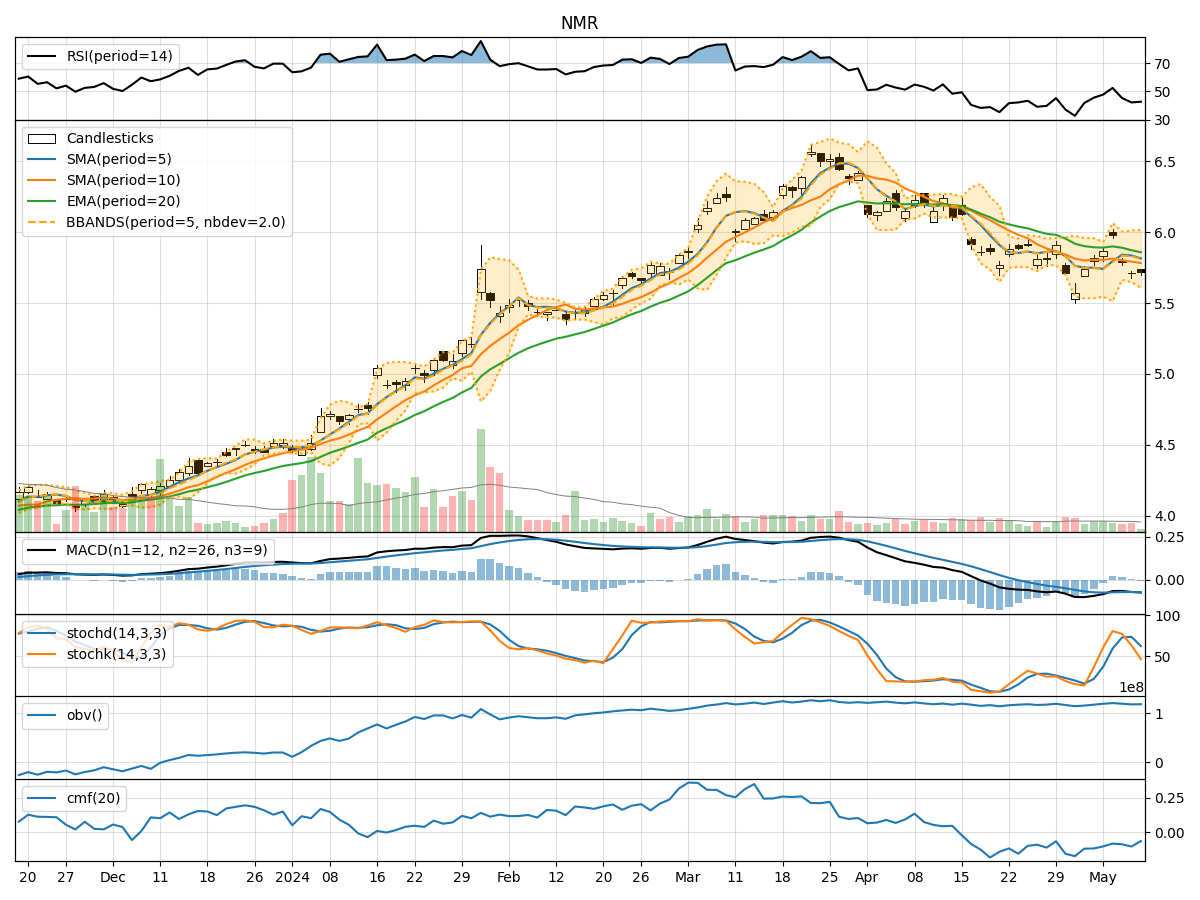
- Moving Averages (MA): The 5-day Moving Average (MA) has been fluctuating around the 5.8 level, indicating a relatively stable trend in the short term.
- MACD: The Moving Average Convergence Divergence (MACD) has been consistently negative, suggesting a bearish momentum in the stock.
- EMA: The Exponential Moving Average (EMA) has been declining, further supporting the bearish sentiment in the short to medium term.
Momentum Analysis:
- RSI: The Relative Strength Index (RSI) has been hovering around the 40-50 range, indicating a neutral momentum with a slight bearish bias.
- Stochastic Oscillator: Both %K and %D have been trending downwards, reflecting a weakening momentum in the stock.
- Williams %R: The Williams %R is in oversold territory, suggesting a potential reversal or bounce in the stock price.
Volatility Analysis:
- Bollinger Bands: The Bollinger Bands have been narrowing, indicating decreasing volatility in the stock.
- Bollinger %B: The %B indicator is below 1, suggesting the stock is trading below the lower Bollinger Band, potentially indicating an oversold condition.
Volume Analysis:
- On-Balance Volume (OBV): The OBV has been relatively flat, indicating a balance between buying and selling pressure.
- Chaikin Money Flow (CMF): The CMF has been negative, indicating a bearish money flow in the stock.
Key Observations and Opinions:
- Trend: The trend indicators suggest a bearish sentiment in the stock, with the MACD and EMA signaling a potential continuation of the downward trend.
- Momentum: The momentum indicators point towards a weakening momentum, with the RSI and Stochastic Oscillator showing bearish signals.
- Volatility: The decreasing volatility as indicated by the Bollinger Bands suggests a period of consolidation or potential stabilization in the stock price.
- Volume: The volume indicators reflect a lack of significant buying or selling pressure, contributing to the neutral outlook.
Conclusion:
Based on the analysis of the technical indicators, the overall outlook for NMR in the next few days leans towards a sideways to slightly bearish movement. The bearish trend and momentum signals, coupled with the lack of significant volatility and volume support, indicate a potential continuation of the current consolidation phase or a slight downward bias in the stock price. Traders and investors should exercise caution and closely monitor key support and resistance levels for potential entry or exit points.