Technical Analysis of NKE 2024-05-10
Overview:
In analyzing the technical indicators for NKE over the last 5 days, we will delve into the trend, momentum, volatility, and volume indicators to provide a comprehensive outlook on the possible stock price movement in the coming days.
Trend Analysis:
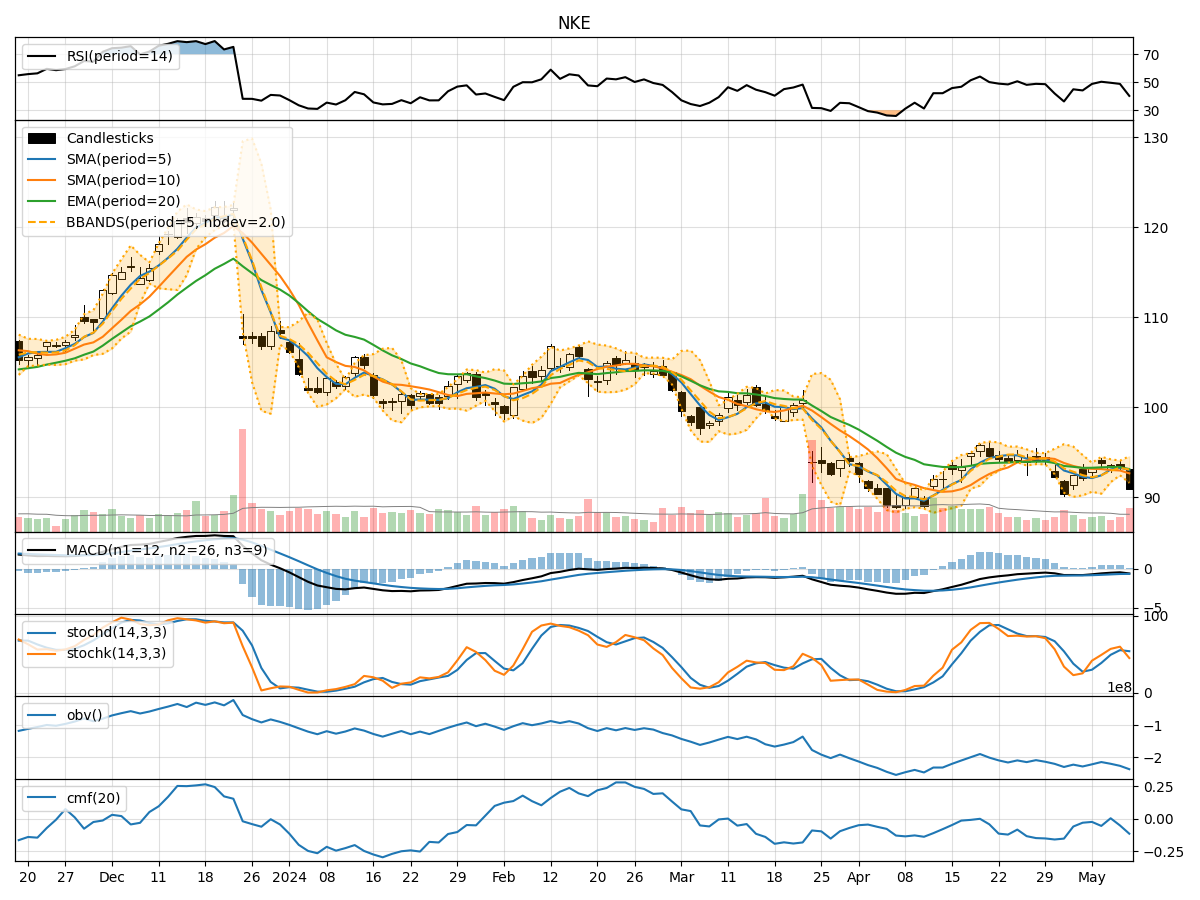
- Moving Averages (MA): The 5-day Moving Average (MA) has been fluctuating around the closing prices, indicating short-term price trends. The Simple Moving Average (SMA) and Exponential Moving Average (EMA) show a slight decline in the recent days.
- MACD: The Moving Average Convergence Divergence (MACD) has been negative, with the MACD line below the signal line, suggesting a bearish trend.
- MACD Histogram: The MACD Histogram has been decreasing, indicating a weakening bearish momentum.
Momentum Analysis:
- RSI: The Relative Strength Index (RSI) has been hovering around the mid-level, indicating a neutral momentum.
- Stochastic Oscillator: The Stochastic Oscillator shows mixed signals, with the %K line crossing the %D line multiple times, reflecting indecision in the market.
- Williams %R: The Williams %R is in oversold territory, suggesting a potential reversal or bounce.
Volatility Analysis:
- Bollinger Bands: The Bollinger Bands have been narrowing, indicating decreasing volatility. The price is currently near the lower band, suggesting a possible oversold condition.
- Bollinger %B: The %B indicator is close to 0, indicating a potential buying opportunity.
Volume Analysis:
- On-Balance Volume (OBV): The OBV has been declining, indicating selling pressure in the market.
- Chaikin Money Flow (CMF): The CMF is negative, suggesting outflow of money from the stock.
Key Observations:
- The trend indicators show a bearish sentiment with declining moving averages and negative MACD.
- Momentum indicators suggest a neutral stance with RSI around the midpoint and stochastic oscillating.
- Volatility is decreasing as per Bollinger Bands, potentially signaling a period of consolidation.
- Volume indicators point towards selling pressure with declining OBV and negative CMF.
Conclusion:
Based on the analysis of the technical indicators, the outlook for NKE in the next few days is bearish. The trend indicators, momentum signals, and volume analysis all point towards a potential downward movement in the stock price. The decreasing volatility may lead to a period of consolidation before a possible continuation of the bearish trend. Traders and investors should exercise caution and consider risk management strategies in light of the current market dynamics.