Technical Analysis of NIO 2024-05-10
Overview:
In analyzing the technical indicators for NIO over the last 5 days, we will delve into the trend, momentum, volatility, and volume indicators to provide a comprehensive outlook on the possible stock price movement in the coming days. By examining these key aspects, we aim to offer valuable insights and recommendations for potential investors.
Trend Indicators:
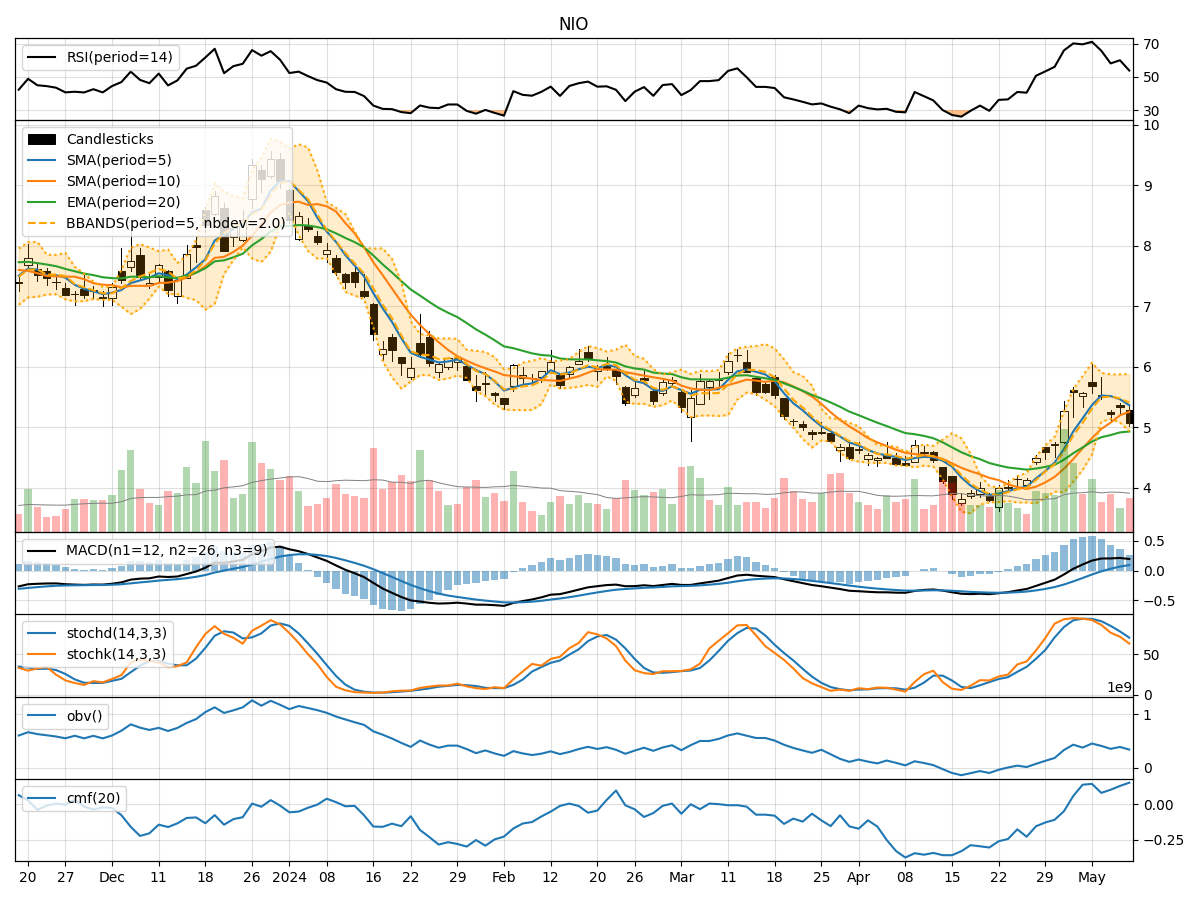
- Moving Averages (MA): The 5-day moving average (MA) has been fluctuating around the closing prices, indicating short-term price trends. The Simple Moving Average (SMA) and Exponential Moving Average (EMA) show an upward trend, suggesting potential bullish momentum.
- MACD: The Moving Average Convergence Divergence (MACD) has been positive, with the MACD line consistently above the signal line. This signals a bullish trend in the stock price.
- Conclusion: The trend indicators suggest an upward momentum in the stock price.
Momentum Indicators:
- RSI: The Relative Strength Index (RSI) has been fluctuating but generally staying within the neutral range, indicating balanced buying and selling pressure.
- Stochastic Oscillator: Both %K and %D have been declining, suggesting a potential reversal in the stock price momentum.
- Conclusion: The momentum indicators show a neutral stance, with a slight bearish bias.
Volatility Indicators:
- Bollinger Bands: The Bollinger Bands show narrowing volatility, with the stock price moving closer to the lower band. This could indicate a potential price breakout in the near future.
- Conclusion: The volatility indicators point towards a potential breakout in the stock price.
Volume Indicators:
- On-Balance Volume (OBV): The OBV has been fluctuating, indicating mixed buying and selling pressure.
- Chaikin Money Flow (CMF): The CMF has been positive, suggesting a net inflow of money into the stock.
- Conclusion: The volume indicators reflect mixed signals, with a slight bullish bias.
Overall Conclusion:
Based on the analysis of the technical indicators, the upward trend indicated by moving averages and MACD, coupled with the potential breakout suggested by volatility indicators, may lead to a bullish price movement in the coming days. However, the neutral momentum and mixed volume signals indicate a degree of uncertainty in the short term.
Recommendation:
Considering the overall analysis, investors should closely monitor the stock price for a potential breakout above the upper Bollinger Band as a confirmation of bullish momentum. It is advisable to set stop-loss levels to manage risk in case of a reversal. Additionally, keeping an eye on key support and resistance levels can help in making informed trading decisions.
Disclaimer:
Remember that technical analysis is not a guaranteed predictor of future price movements, and other fundamental factors can influence stock prices. It is essential to conduct thorough research and consider multiple indicators before making any investment decisions. Consulting with a financial advisor is recommended for personalized investment advice tailored to individual risk tolerance and financial goals.