Technical Analysis of NAT 2024-05-10
Overview:
In analyzing the technical indicators for NAT over the last 5 days, we will delve into the trend, momentum, volatility, and volume indicators to provide a comprehensive outlook on the possible stock price movement in the coming days. By examining these key aspects, we aim to offer valuable insights and predictions to guide your investment decisions.
Trend Analysis:
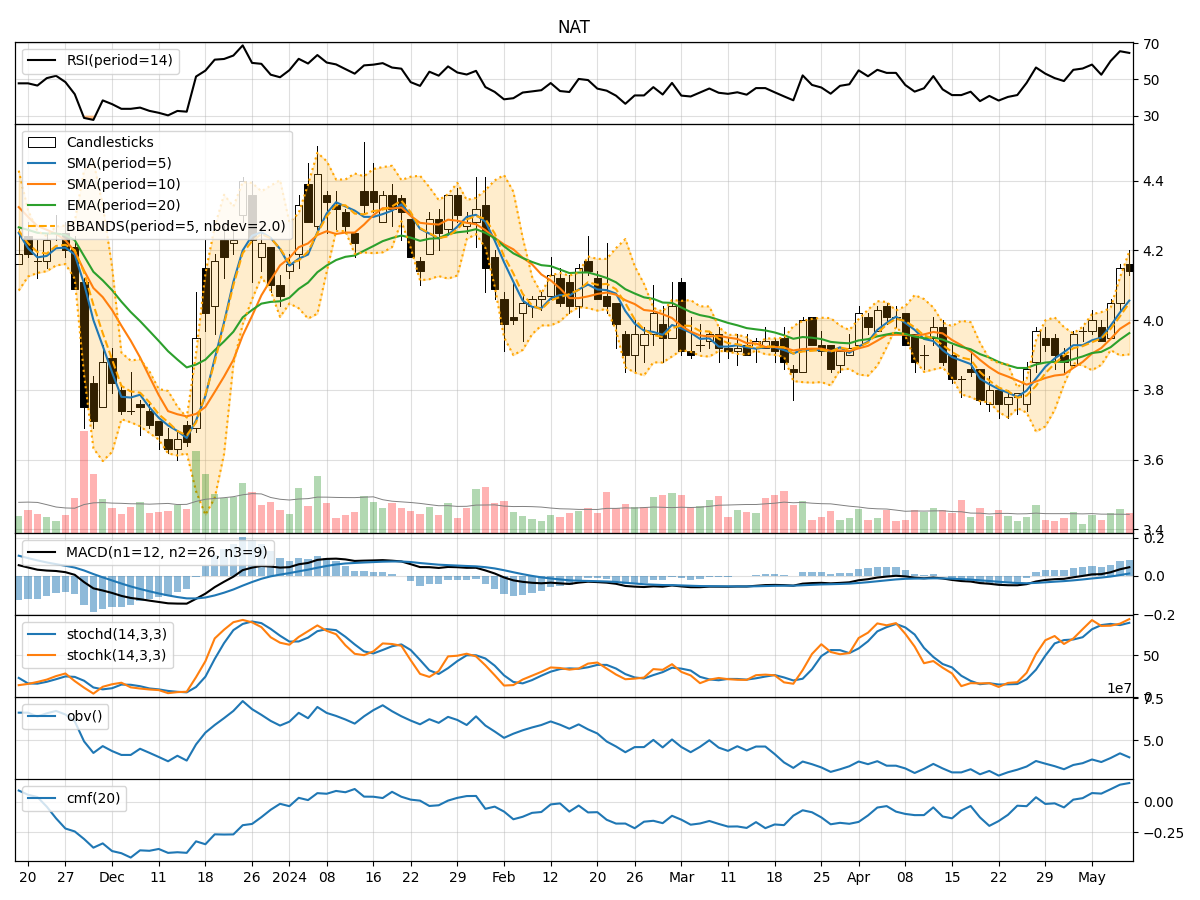
- Moving Averages (MA): The 5-day Moving Average (MA) has been consistently above the closing prices, indicating a short-term uptrend.
- MACD: The MACD line has been consistently above the signal line, suggesting bullish momentum.
- EMA: The Exponential Moving Average (EMA) has been trending upwards, supporting the bullish sentiment.
Momentum Analysis:
- RSI: The Relative Strength Index (RSI) has been fluctuating around the overbought territory, indicating strong buying pressure.
- Stochastic Oscillator: Both %K and %D have been in the overbought zone, signaling a potential reversal.
- Williams %R: The Williams %R has been hovering in the oversold region, suggesting a possible buying opportunity.
Volatility Analysis:
- Bollinger Bands (BB): The stock price has been trading within the Bollinger Bands, with the bands widening, indicating increased volatility.
- Bollinger %B: The %B indicator has been fluctuating, reflecting the price's relationship to the bands.
Volume Analysis:
- On-Balance Volume (OBV): The OBV has been fluctuating, indicating mixed buying and selling pressure.
- Chaikin Money Flow (CMF): The CMF has been positive, suggesting accumulation by investors.
Key Observations:
- The trend indicators suggest a bullish sentiment with moving averages and MACD supporting an upward trajectory.
- Momentum indicators show mixed signals with RSI indicating strength but Stochastic Oscillator hinting at a potential reversal.
- Volatility has increased, as seen in the widening Bollinger Bands, indicating potential price swings.
- Volume indicators reflect mixed sentiment with OBV fluctuating and CMF showing accumulation.
Conclusion:
Based on the analysis of technical indicators, the stock price of NAT is likely to experience further upward movement in the coming days. The bullish trend supported by moving averages and MACD, coupled with positive RSI, suggests continued buying interest. However, caution is advised as the Stochastic Oscillator signals a potential reversal, and increased volatility could lead to price fluctuations. Overall, the outlook remains bullish with a possibility of consolidation before potential further upside.