Technical Analysis of MTX 2024-05-31
Overview:
In analyzing the technical indicators for MTX over the last 5 days, we will delve into the trend, momentum, volatility, and volume indicators to provide a comprehensive outlook on the possible stock price movement in the coming days. By examining these key aspects, we aim to offer valuable insights and predictions for potential investors.
Trend Indicators:
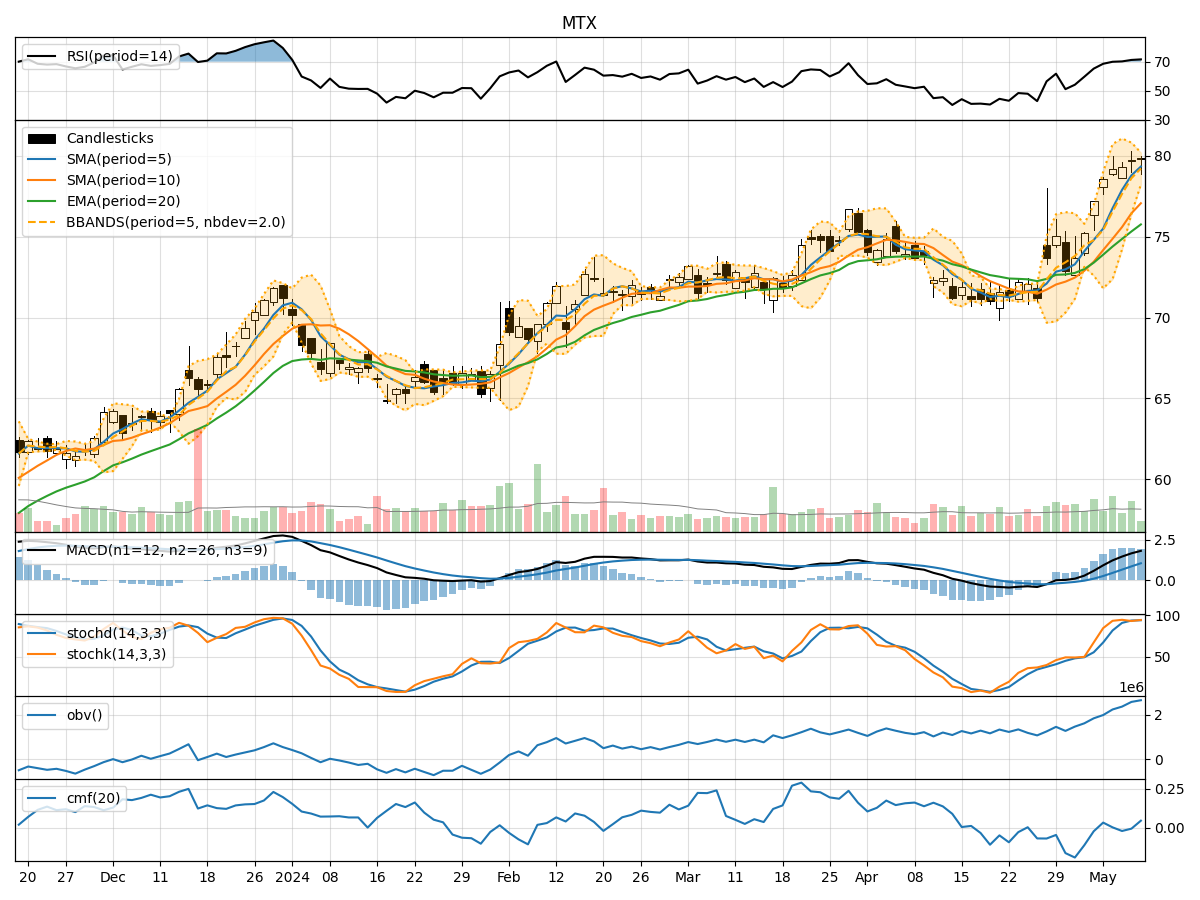
- Moving Averages (MA): The 5-day Moving Average has been consistently above the longer-term Simple Moving Average (SMA) and Exponential Moving Average (EMA), indicating a bullish trend.
- MACD: The Moving Average Convergence Divergence shows positive values for both the MACD line and signal line, suggesting upward momentum.
- MACD Histogram: The MACD Histogram has been increasing, indicating strengthening bullish momentum.
Momentum Indicators:
- RSI: The Relative Strength Index has been in the overbought territory, suggesting a potential pullback in the stock price.
- Stochastic Oscillator: Both %K and %D lines have been relatively high, indicating a strong bullish momentum.
- Williams %R: The Williams %R is in the oversold region, signaling a potential reversal in the stock price.
Volatility Indicators:
- Bollinger Bands: The stock price has been trading within the Bollinger Bands, with the bands widening slightly, indicating increased volatility.
- Bollinger %B: The %B indicator is below 1, suggesting the stock price is trading below the lower band, potentially indicating an oversold condition.
Volume Indicators:
- On-Balance Volume (OBV): The OBV has shown a mixed trend over the last 5 days, indicating indecision among investors.
- Chaikin Money Flow (CMF): The CMF has been positive, suggesting buying pressure in the stock.
Key Observations and Opinions:
- Trend: The trend indicators point towards a strong bullish sentiment in the stock, supported by the moving averages and MACD.
- Momentum: The momentum indicators show conflicting signals, with RSI indicating overbought conditions and Stochastic Oscillator signaling strong bullish momentum.
- Volatility: The volatility indicators suggest an increase in price fluctuations, potentially leading to both trading opportunities and risks.
- Volume: The volume indicators reflect mixed sentiment among investors, with OBV showing uncertainty and CMF indicating buying pressure.
Conclusion:
Based on the analysis of the technical indicators, the next few days' possible stock price movement for MTX is likely to be upward with a bullish bias. Despite some conflicting signals in the momentum indicators, the overall trend strength and positive momentum signals from the trend indicators support a potential continuation of the uptrend. Traders should monitor the RSI for potential overbought conditions and consider the widening Bollinger Bands for increased volatility. Overall, the outlook for MTX appears favorable for further price appreciation in the near term.