Technical Analysis of MT 2024-05-10
Overview:
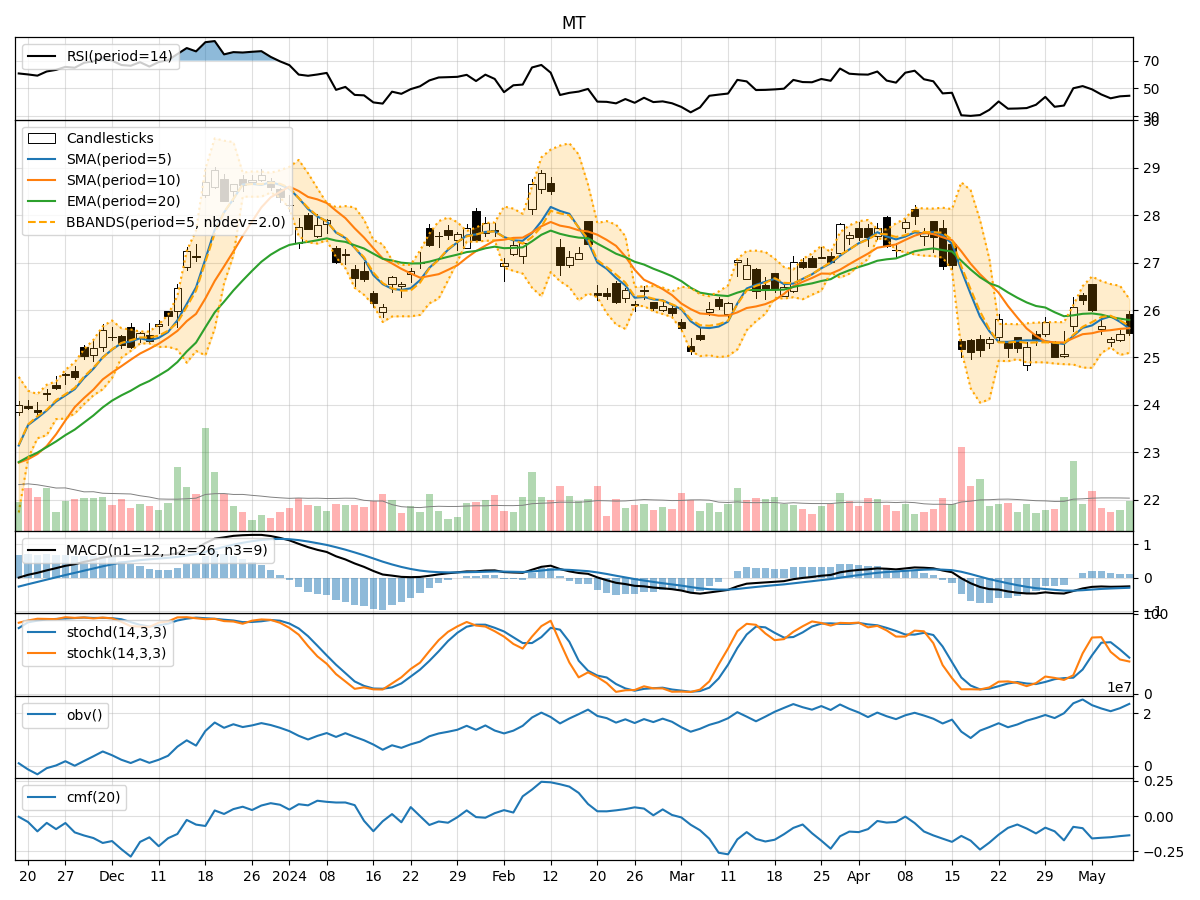
In the last 5 trading days, the stock price of MT has shown a slight decline from 26.01 to 25.52. Various technical indicators have been analyzed to provide insights into the possible future movement of the stock price. The analysis covers trend indicators, momentum indicators, volatility indicators, and volume indicators.
Trend Indicators:
- Moving Averages (MA): The 5-day MA has been slightly below the closing price, indicating a short-term downtrend.
- MACD: The MACD line has been negative, suggesting a bearish momentum.
- EMA: The EMA has been declining, reflecting a weakening trend.
Key Observation: The trend indicators point towards a bearish sentiment in the short term.
Momentum Indicators:
- RSI: The RSI has been hovering around the neutral zone, indicating a lack of strong momentum.
- Stochastic Oscillator: Both %K and %D have been decreasing, signaling a potential downtrend.
- Williams %R: The indicator has been in the oversold territory, suggesting a possible reversal.
Key Observation: Momentum indicators suggest a mixed sentiment with a slight bearish bias.
Volatility Indicators:
- Bollinger Bands: The bands have been narrowing, indicating decreasing volatility.
- Bollinger %B: The %B has been relatively low, suggesting a potential oversold condition.
Key Observation: Volatility indicators point towards a decrease in volatility and a possible consolidation phase.
Volume Indicators:
- On-Balance Volume (OBV): The OBV has shown a slight increase, indicating some buying pressure.
- Chaikin Money Flow (CMF): The CMF has been negative, reflecting a bearish money flow.
Key Observation: Volume indicators suggest a neutral to slightly bearish sentiment.
Conclusion:
Based on the analysis of the technical indicators, the next few days' possible stock price movement for MT is likely to continue in a downward trend with increased bearish sentiment. The trend indicators, momentum indicators, and volume indicators all point towards a bearish outlook, while volatility indicators suggest a consolidation phase with decreased volatility. Traders and investors should exercise caution and consider potential short-selling opportunities or wait for a clear reversal signal before considering long positions.
Overall View: Bearish with a potential for further downside movement in the near term.