Technical Analysis of MSCI 2024-05-10
Overview:
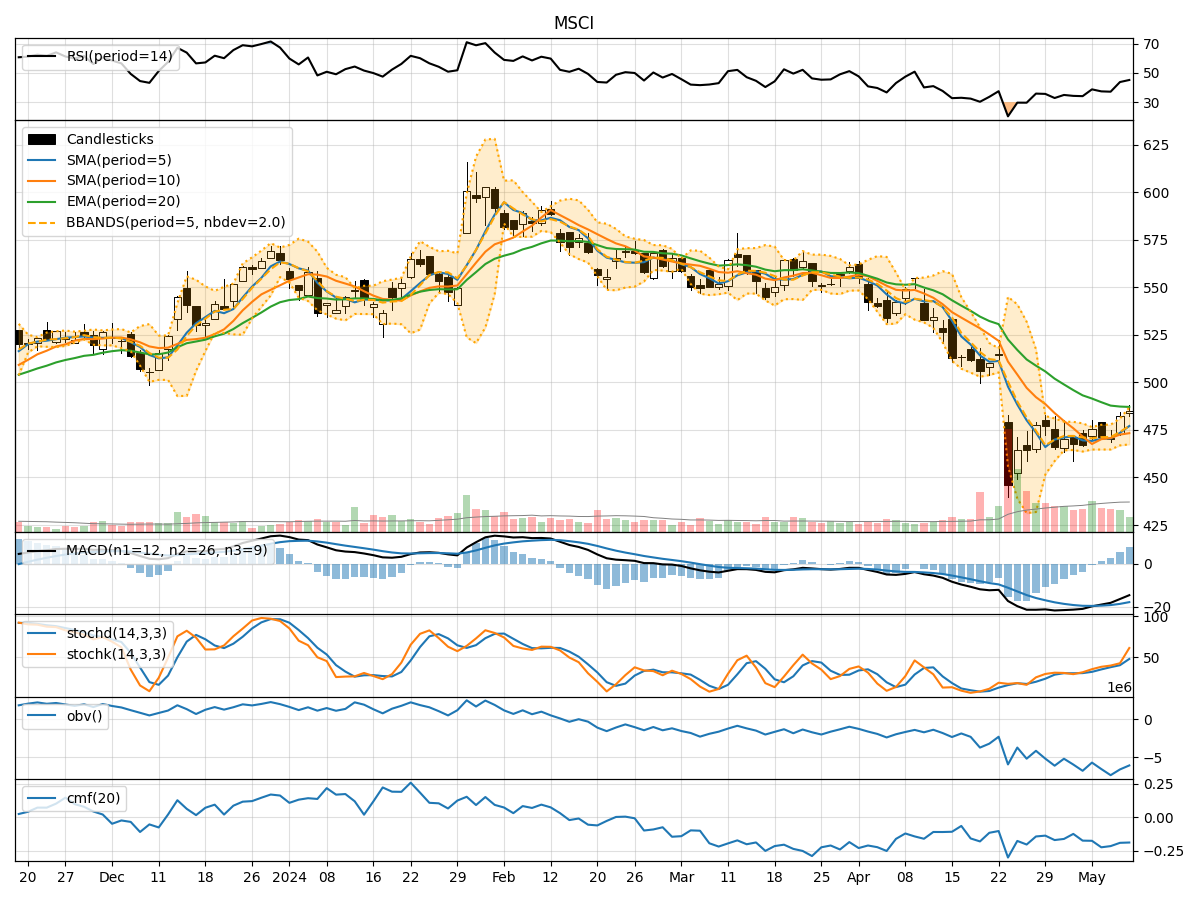
In analyzing the MSCI stock using technical indicators over the last 5 days, we will delve into the trend, momentum, volatility, and volume indicators to provide a comprehensive outlook on the possible stock price movement in the coming days.
Trend Analysis:
- Moving Averages (MA): The 5-day Moving Average (MA) has been consistently rising, indicating a bullish trend in the short term.
- MACD: The MACD line has been increasing, showing bullish momentum in the stock price.
- EMA: The Exponential Moving Average (EMA) has been declining slightly, suggesting a potential reversal in the trend.
Momentum Analysis:
- RSI: The Relative Strength Index (RSI) has been increasing, indicating strengthening momentum in the stock.
- Stochastic Oscillator: Both %K and %D have been rising, signaling bullish momentum.
- Williams %R: The Williams %R is in the oversold territory, suggesting a potential buying opportunity.
Volatility Analysis:
- Bollinger Bands (BB): The stock price has been trading above the middle Bollinger Band, indicating an uptrend with moderate volatility.
- Bollinger Band Width (BBW): The BBW has been expanding, suggesting increasing volatility in the stock price movement.
Volume Analysis:
- On-Balance Volume (OBV): The OBV has been declining, indicating selling pressure in the stock.
- Chaikin Money Flow (CMF): The CMF has been negative, suggesting outflow of money from the stock.
Conclusion:
Based on the analysis of the technical indicators: - Trend: The stock is currently in an upward trend supported by the moving averages and MACD. - Momentum: Momentum indicators like RSI and Stochastic Oscillator suggest bullish momentum in the stock. - Volatility: The expanding Bollinger Band Width indicates increasing volatility, which could lead to larger price swings. - Volume: The declining OBV and negative CMF signal selling pressure in the stock.
Forecast:
Considering the overall bullish trend and momentum, the stock is likely to continue its upward movement in the coming days. However, the increasing volatility and selling pressure indicated by volume indicators may lead to short-term price fluctuations. Investors should monitor the stock closely for potential buying opportunities during dips in price. Overall, the outlook for the stock is bullish with short-term volatility expected.