Technical Analysis of MSC 2024-05-10
Overview:
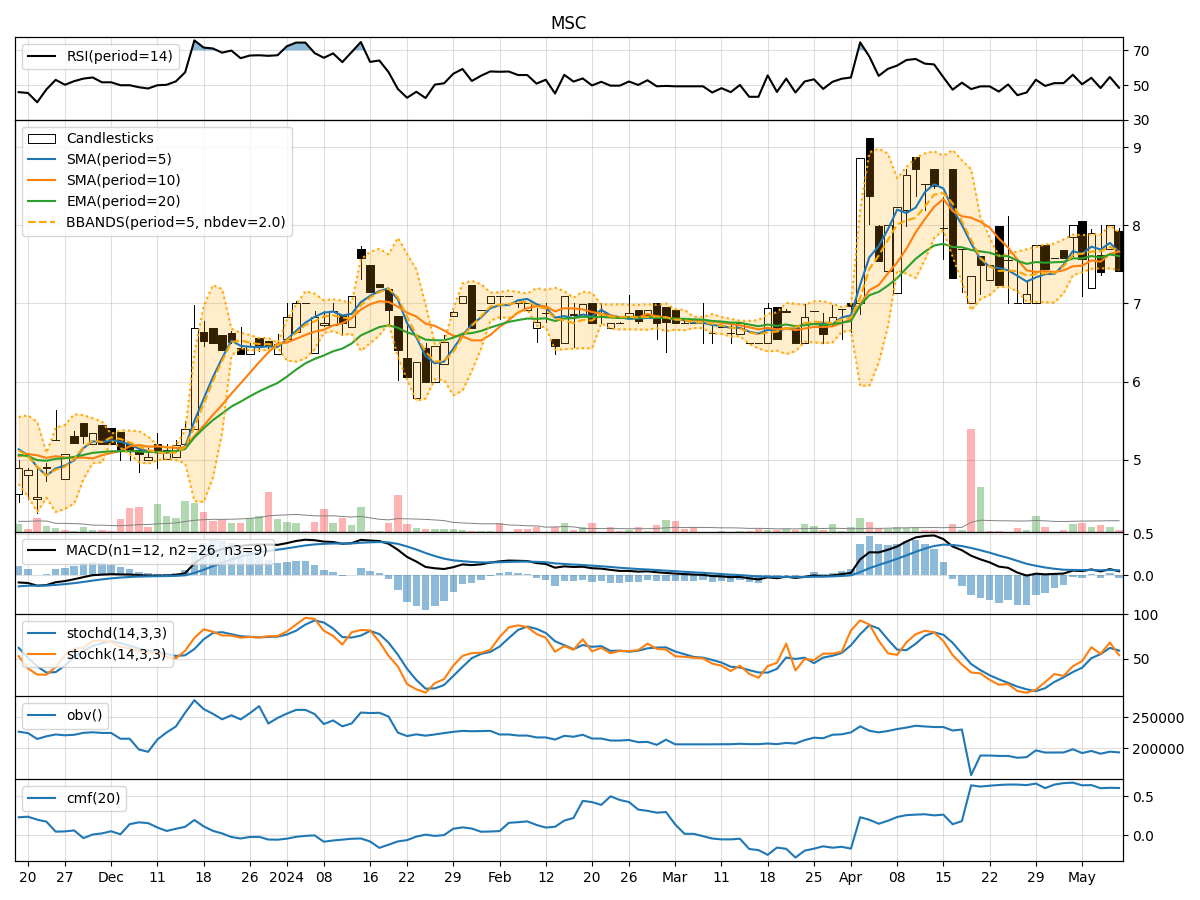
In analyzing the technical indicators for MSC stock over the last 5 days, we will delve into the trends, momentum, volatility, and volume aspects to provide a comprehensive outlook on the possible stock price movement in the coming days. By examining key indicators such as moving averages, MACD, RSI, Bollinger Bands, and OBV, we aim to offer valuable insights and predictions for potential price action.
Trend Analysis:
- Moving Averages (MA): The 5-day MA has been fluctuating around the closing prices, indicating short-term price trends.
- MACD: The MACD line has shown slight fluctuations, with the MACD histogram hovering around the zero line, suggesting a balanced market sentiment.
- EMA: The EMA has been relatively stable, reflecting a smoother trend compared to the MA.
Key Observation: The trend indicators suggest a neutral to slightly bullish sentiment in the short term.
Momentum Analysis:
- RSI: The RSI values have been oscillating around the mid-level, indicating a balanced momentum between buying and selling pressure.
- Stochastic Oscillator: The Stochastics have shown mixed signals, with occasional overbought and oversold conditions.
- Williams %R: The Williams %R values have fluctuated, but no extreme levels have been reached.
Key Observation: Momentum indicators suggest a lack of strong directional bias, with potential for price consolidation.
Volatility Analysis:
- Bollinger Bands (BB): The Bollinger Bands have shown moderate volatility, with the price mostly staying within the bands.
Key Observation: Volatility remains within manageable levels, indicating a stable price range.
Volume Analysis:
- On-Balance Volume (OBV): The OBV values have fluctuated, reflecting mixed buying and selling pressure.
- Chaikin Money Flow (CMF): The CMF values have been positive, indicating a net inflow of money into the stock.
Key Observation: Volume indicators suggest a balanced accumulation and distribution pattern.
Conclusion:
Based on the analysis of the technical indicators, the stock price of MSC is likely to experience sideways movement in the coming days. The lack of strong trends in both momentum and trend indicators, coupled with stable volatility and volume patterns, indicates a period of consolidation. Traders may expect the stock to trade within a narrow range without significant price fluctuations.
Recommendation:
- Short-term Traders: Consider range-bound strategies or scalping within the current price range.
- Long-term Investors: Monitor for a breakout or breakdown from the consolidation phase before making significant investment decisions.
Disclaimer:
Remember that market conditions can change rapidly, and it is essential to adapt your strategies accordingly. Always combine technical analysis with fundamental research for a holistic view of the market.